
In BriefBuilder’s navigation menu, under the header diagrams, you can find something that is called an interfaces diagram, which is particularly useful for viewing relations between different technical systems and elements within your model.
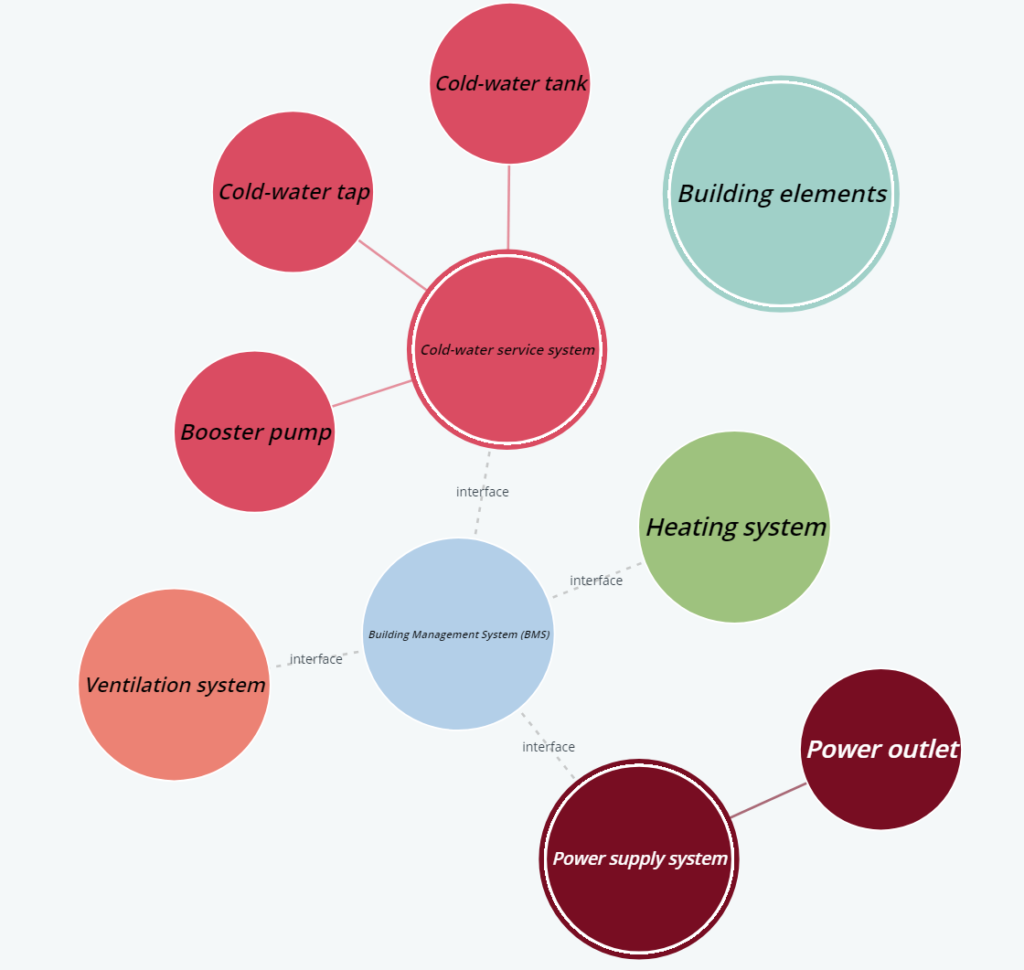
An interfaces diagram is a visual overview of the interface relations between the technical objects in a model (i.e. systems and spatial elements). Each system or spatial element has been visualised as a circle and the relation between two as a line.
Below, we will explain more about the purpose and workings of this kind of diagram.
Purpose
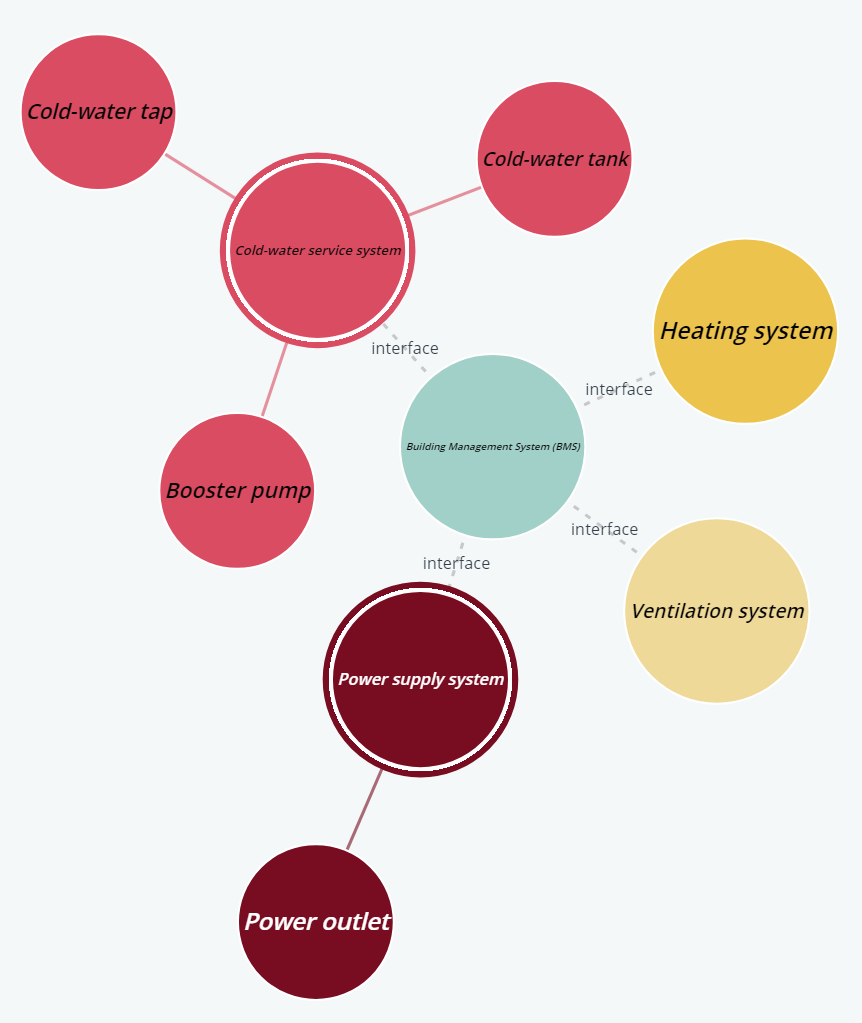
The main purpose of an interfaces diagram is to specify how different systems and elements interface and/or link with each other. For example, to define that the building management system (BMS) should be linked to the building’s climate system. Or, for a road project, that there should be a link or relation between the road’s signage system and a traffic management system.
This is the type of diagram that is often been used in PowerPoint presentations or management reports. Please note, however, that interfaces diagrams can be quite complex. It can be a smart choice to zoom in on particular parts (use the scroller on your mouse) and/or exclude ‘groups’ of building elements by using the filter option (click on the icon) to make it more understandable.
Input data
The interfaces diagram is generated on the basis of the data that has been defined in the BriefBuilder model. Specifically, it concerns the following data:
- The building systems and elements, as defined in the systems / elements tree.
- The interface relations between systems and elements, as defined in the table interfaces with other systems/elements on the detail view of a building element (see image below).
So, if you want make changes to the diagram (other than just visual changes), that is where you have to do it.

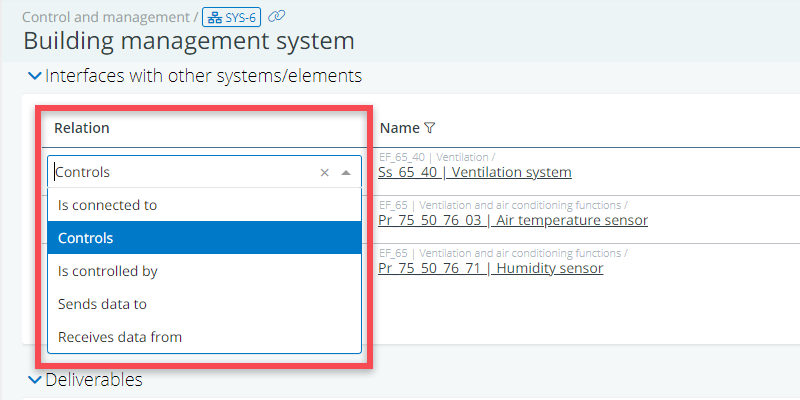
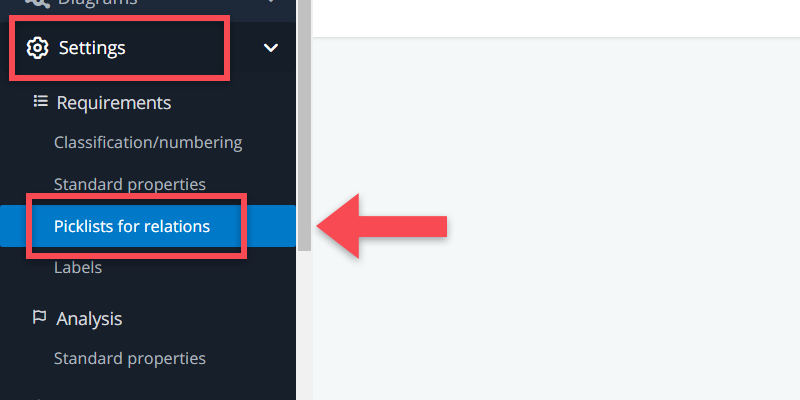
As you can see in the screendumps above, there may be different kinds of interface relations. You can define these in the settings menu. You have to go to:
Settings > Requirements > Picklists for relations
Legend
A BriefBuilder interfaces diagram can consist of the following elements:
Bubbles: each bubble represents a system or a spatial element.
Bubbles with white border line: these bubbles represent systems or folders that function as ‘parent’ objects for spatial elements or other systems.
Continuous lines: these lines represent “part-of” relations. These are the same relations that are being used in the systems & elements tree, and indicate the hierarchy of that tree. For example, a power socket ‘belonging’ or being a part of a power supply system.
Dotted lines: These lines are the interface relations. They indicate how building elements are linked to each other. The dotted lines are accompanied by a text that says ‘interface’ for extra visual clarity.
Arrows: arrows indicate that a relation has a particular direction, e.g. indicating that a system “is being controlled by” or “receiving data from” another system.
Actions
There are a number of relevant actions when working with the diagram:
Filter: You can filter on what you get to see in the diagram by using the filter option (click on (). This is a crucial functionality because interface diagrams can be quite complex.
Zoom: You can zoom in on a part of the diagram by using the scroll wheel on your mouse. Click on the icon to resize the diagram to your screen size.
Download: You can download the image (by clicking on the icon) in a PNG format or a vector format. The advantage of the latter is that you can easily change the image (e.g. colours, fonts, …) in programs like Adobe Illustrator or Microsoft Visio for presentation purposes.
Re-order: You can re-organise the diagram by clicking on a ‘bubble’ and then dragging it to a place where you want to have place it. This also allows you to create a clearer overview of the diagram as a whole.
Interface table
Note that interface relations can also be edited and presented in a table. For this, go to the cross tables – requirements in the navigation menu (under ‘Overviews’) and select the tree Systems & Elements for both rows and columns. That will give you what is commonly known as an interface matrix
