
BriefBuilder has a dedicated requirement diagram feature that enables you to create, edit, and view requirement diagrams that are generated based on the model’s contents.
The objective of this feature is to enable you to create visual overviews of the objects in your model and their interrelations, which can help the design team and other stakeholders get a better understanding of the requirements.

In this article, we will explain the practicalities of this feature.
Diagram parts
In BriefBuilder, diagrams are composed of the following parts:
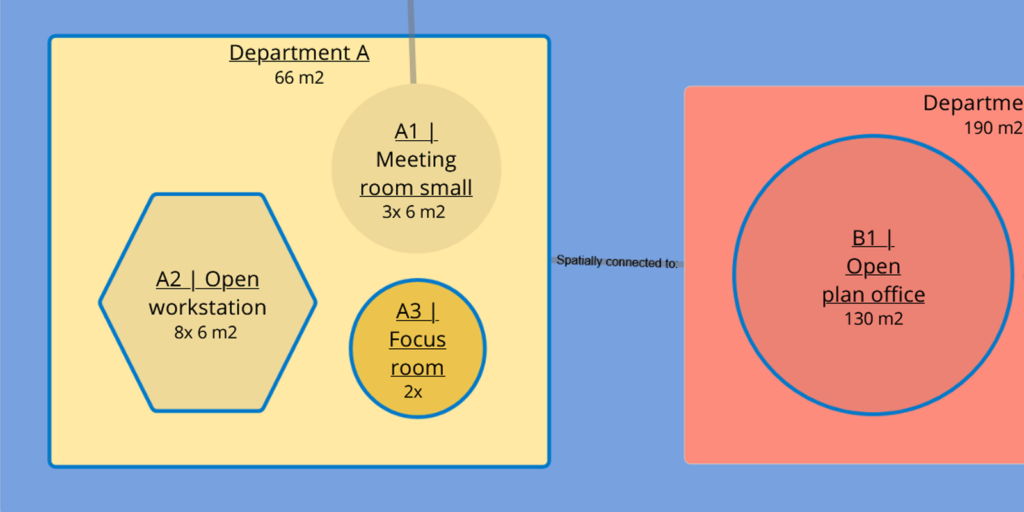
Objects: These are the key entities of a model, e.g. spaces or spatial elements. Their default shape is a circle, unless they contain other objects (see next, ‘parent objects’). These objects are the most flexible part of the diagram as you can change their colour, shape, size and position.

Parent objects: These are the ‘containers’ of the aforementioned objects. They are called ‘parents’ because they contain smaller ‘child’ objects. Think about groups of spaces, systems or folders. Parent objects are always represented as rectangles.
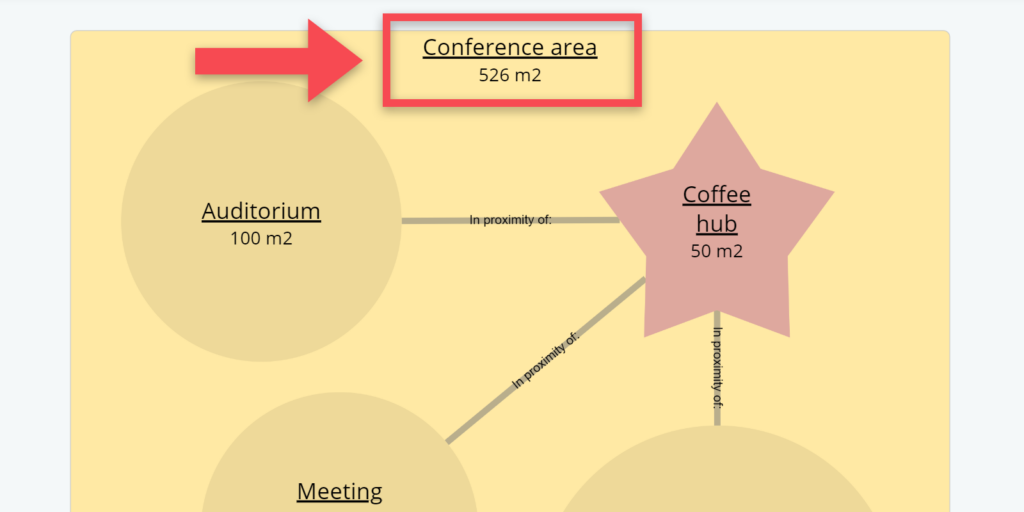
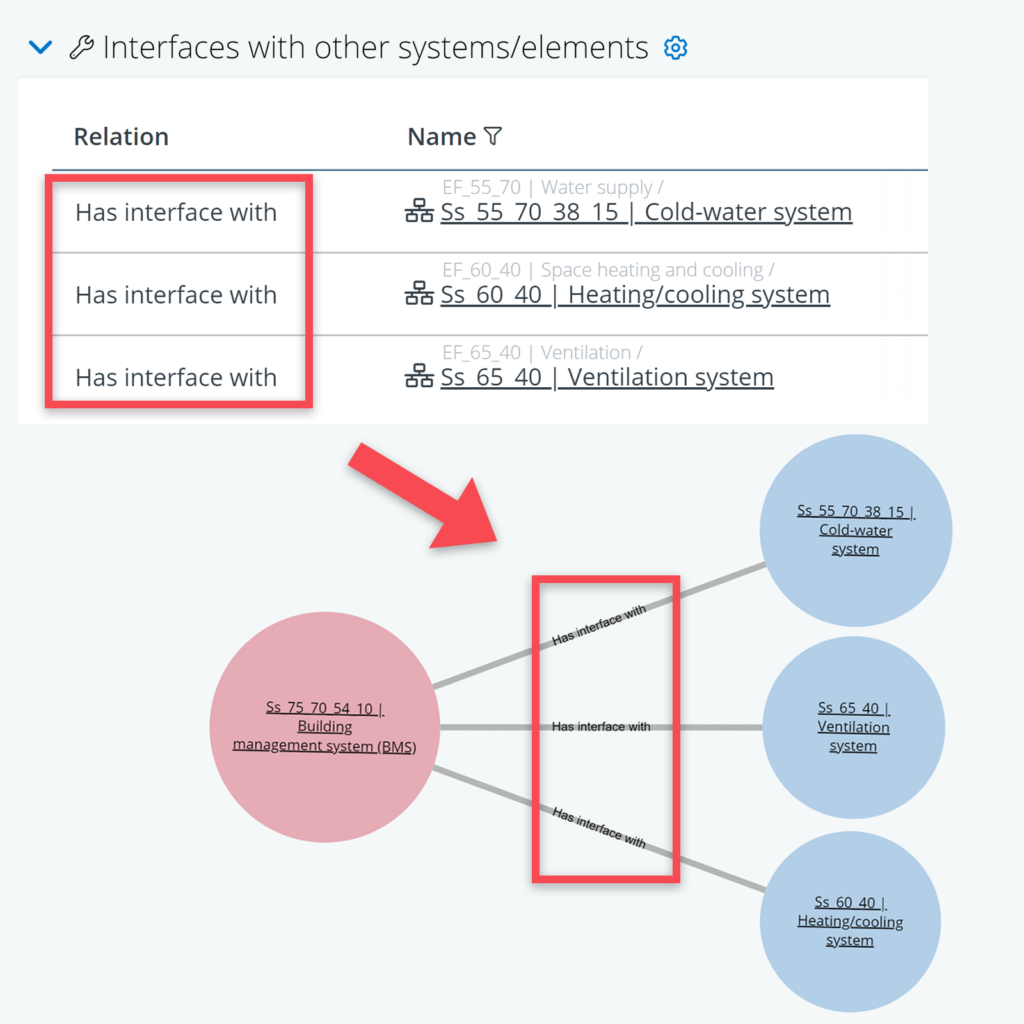
Relations: These are the relations between the different objects as they have been defined in the model (e.g. interface or adjacency relations). Relations are represented as grey lines. If it concerns a special type of relation (e.g. a proximity relation or connection), this is shown as text inside the line.

Input
The diagrams are created and generated on the basis of the model’s contents. So, to be able to create a diagram, you first need to define objects, and relations in your BriefBuilder model.
You can create objects in the various tree structures in the model. Relations can be defined on the detail view of an object.
For spatial diagrams, the adjacency relations tend to be most important. For technical diagrams, it is usually the interface relations. In both cases, these relations are visualized as lines in the diagram. See the example below.
Creating a requirement diagram
To create a diagram, go to the Requirement diagrams section in the navigation menu.
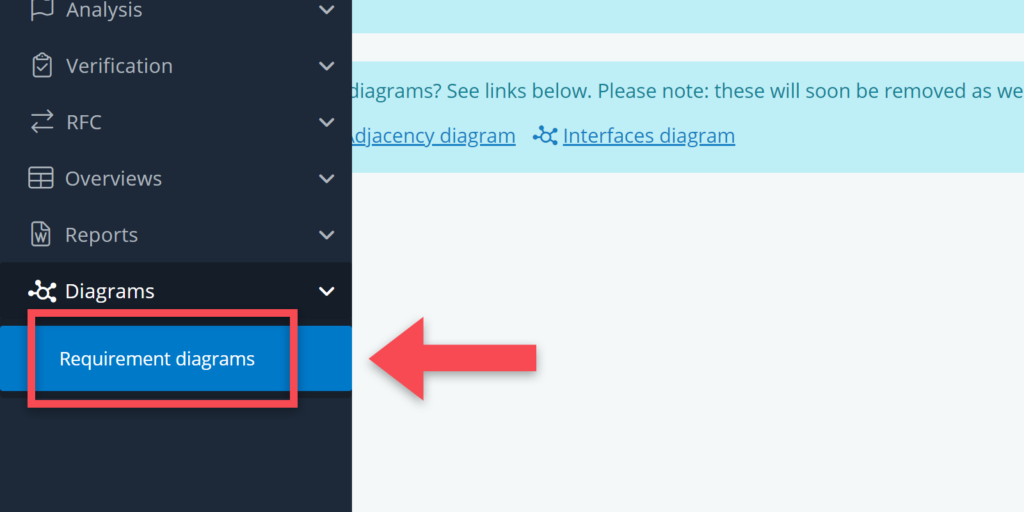
Clicking on this menu item will bring you to the requirement diagram overview page. On this page you will see an overview of available diagrams, split into two categories:
- For private use: these are diagrams that are only visible to you.
- For all users: these are diagrams that are available to all users in the project model.
When you create a diagram, you have the option to save it as a public diagram for everyone to use or you can save it for private use.
To make a new diagram, do the following:
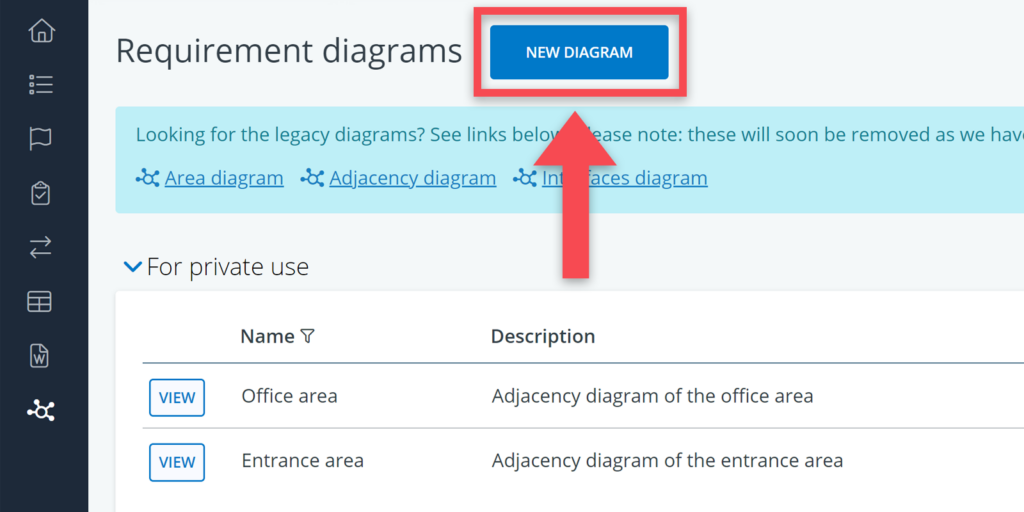
Step 1: Click on ‘new diagram’
Go to the overview page and click on the blue button at the top that reads New Diagram.
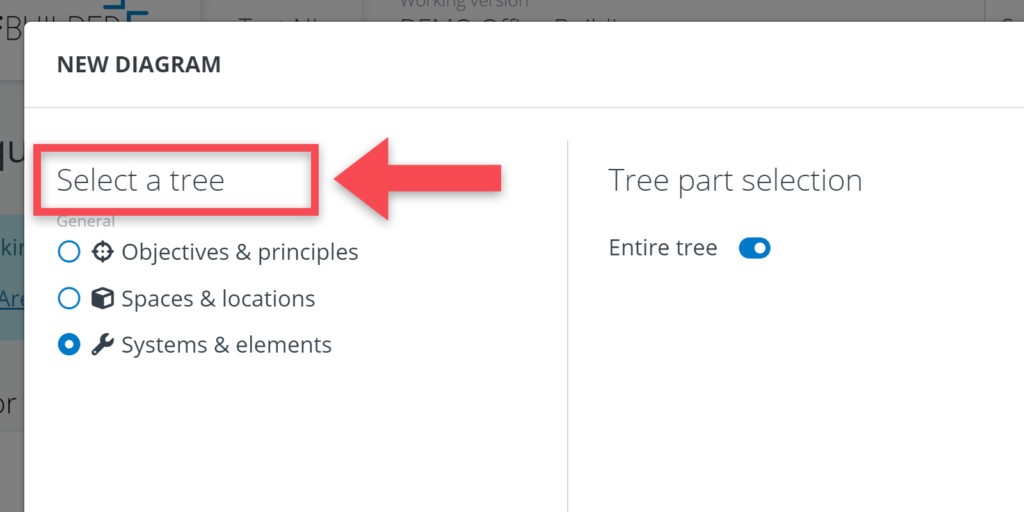
Step 2: Select tree
When you have clicked on New Diagram, a pop-up window will open. On the left-hand side of this menu, you can select the tree that you want to create a diagram of (e.g. Spaces & locations, or Systems & elements).
After having made your tree selection, you can move over to the right-hand side and opt for a selection of the entire tree or make a selection of objects from that tree.
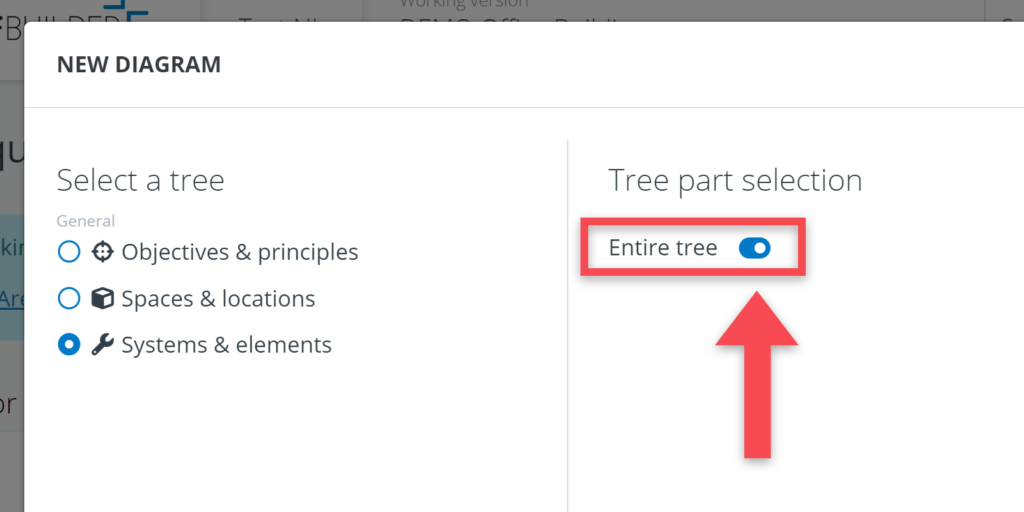
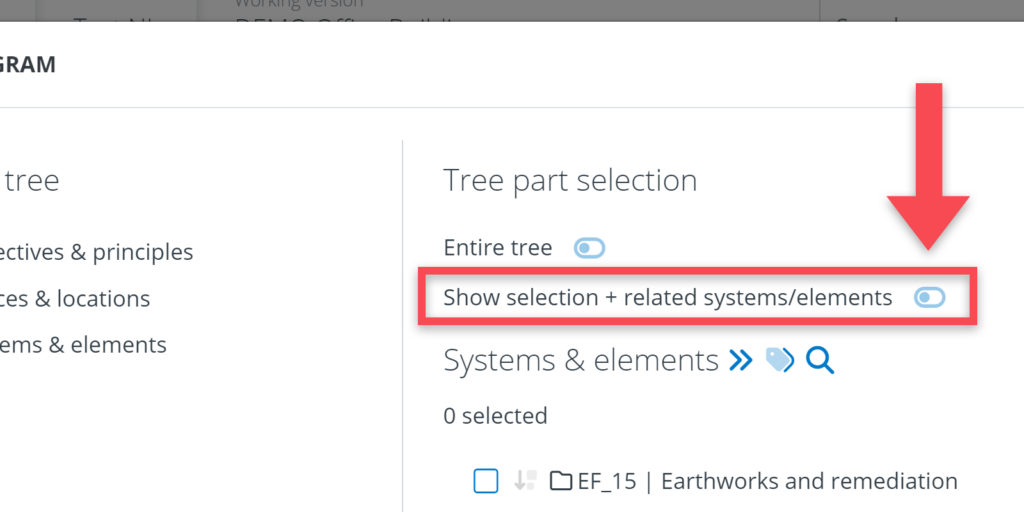
When you have made your selections, click on Continue.
Step 3: Edit your diagram
Completing step 2 will lead you to the diagram itself. As you will notice, the software will generate a diagram for you. This diagram is based on the requirements in the model, but it is quite likely, that you will want to make some changes to the diagram.
To make changes to your diagram, you have to select the objects that you want to change. Objects can be selected by clicking on them. A blue border will be shown around the selected objects.
Once you have selected one or more objects, you have the following edit possibilities:
Move objects
Any of the objects can be moved by holding down the left-click mouse button and dragging the mouse. When multiple objects are selected you can move them around while maintaining relative distances to each other.
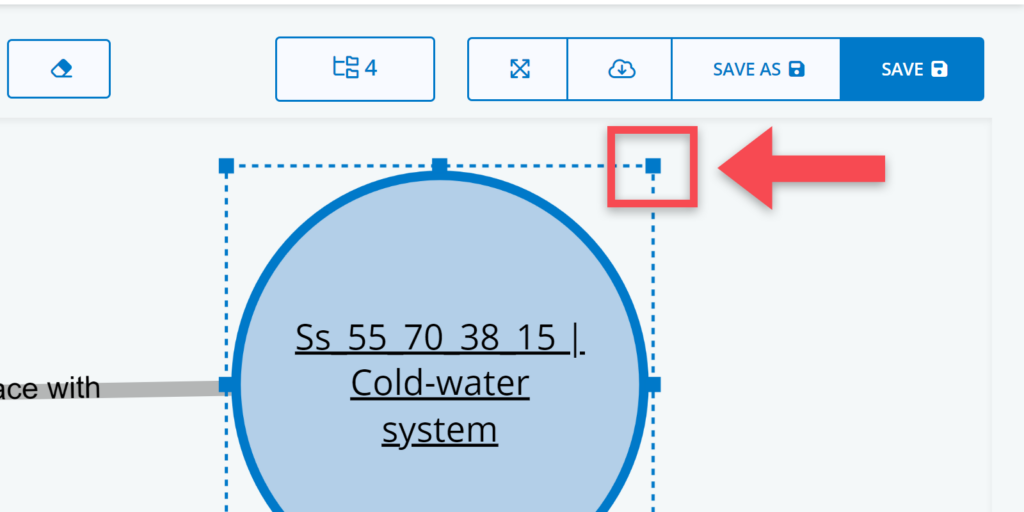
Change sizes / proportions
You can change the size and proportions of an object by clicking and dragging the small blue squares of the selected object.
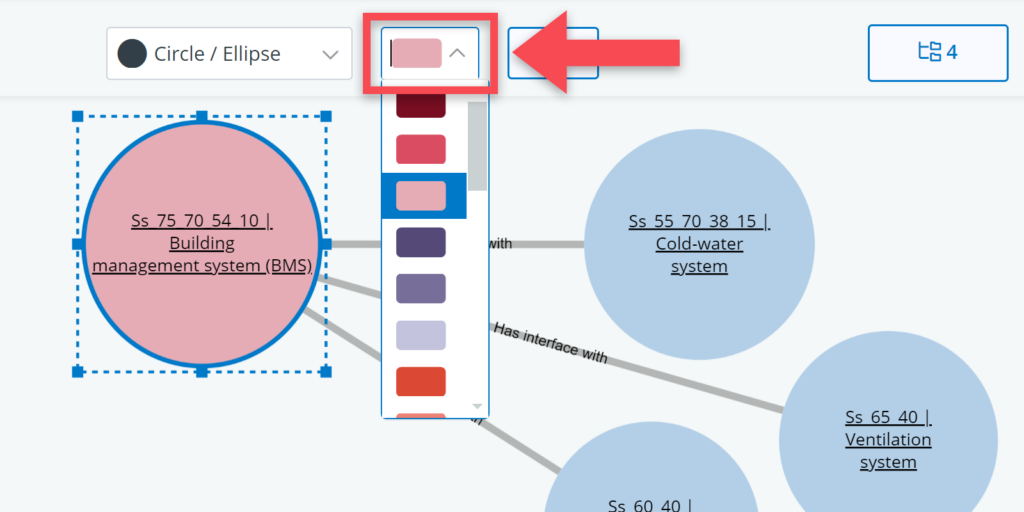
Change colours
Every object can be changed in colour. Select one or multiple objects and select a colour from the drop-down menu at the top of the page.
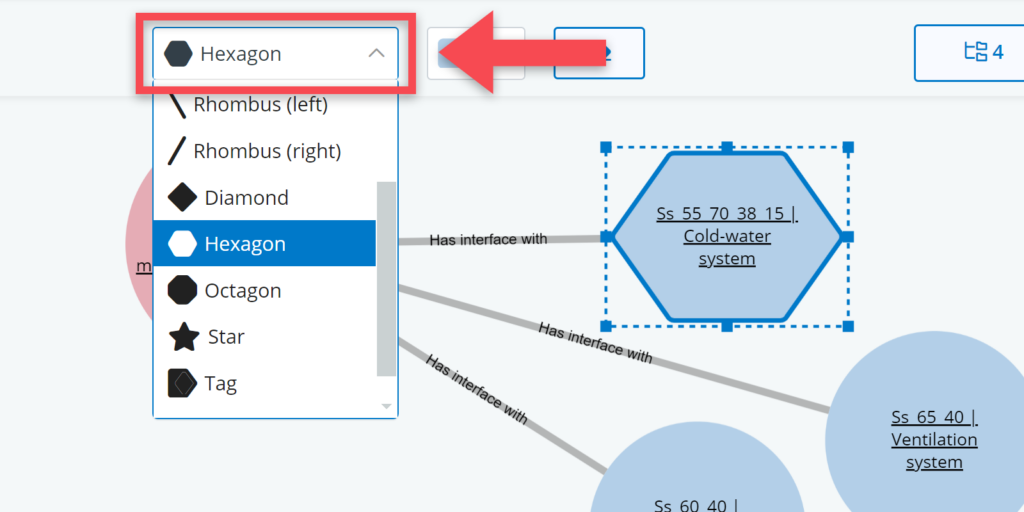
Change shape
For ‘non-parent’ objects (e.g. spaces or elements) you can change the shape by first selecting the object and then selecting any of the shapes in the drop-down menu at the top of the page.
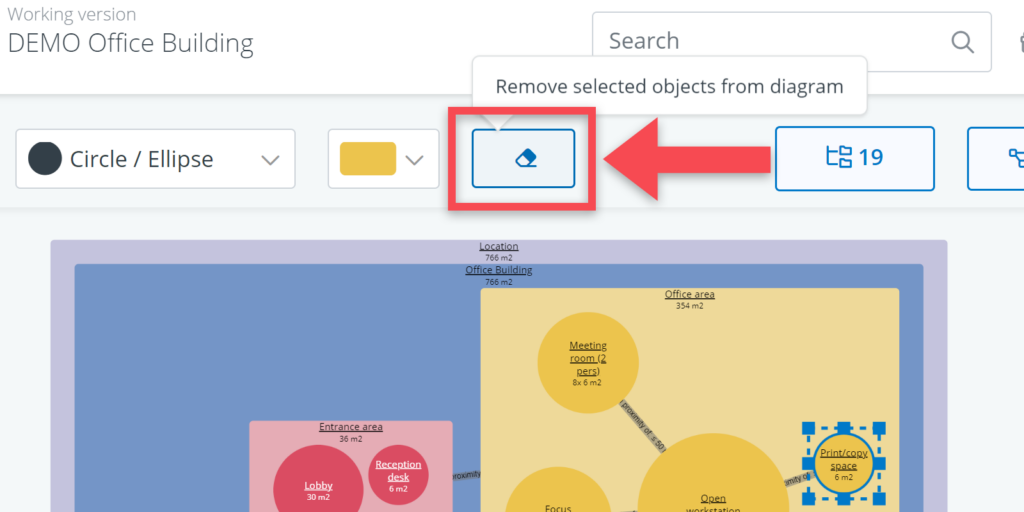
Remove objects
You can remove objects from your diagram by selecting an object and clicking on the remove button () from the menu). Please note: you are only removing the object from the diagram (e.g. because you want to simplify the diagram), not from the model.
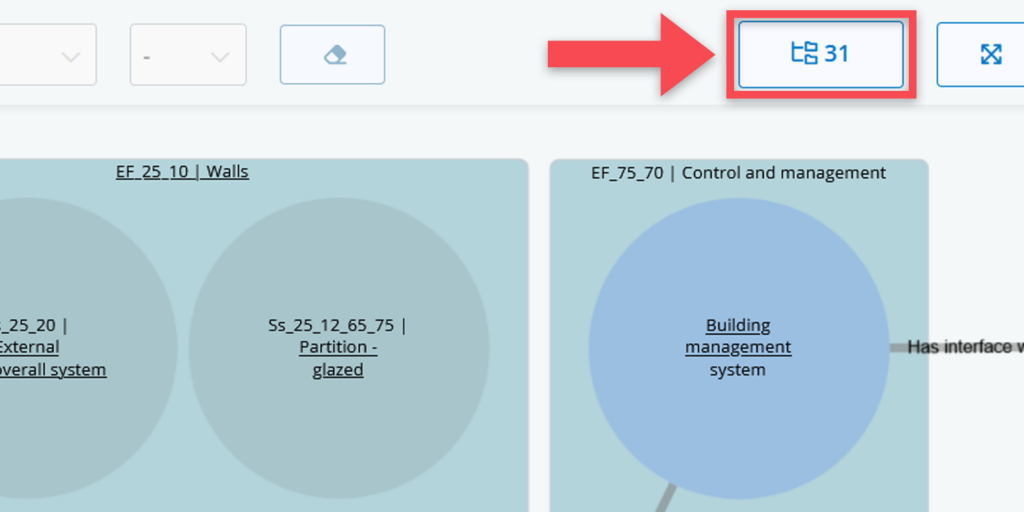
Add objects
You can add objects to your diagram by using the tree structure button. This button will open up a tree selection window in which you can select one or more objects to add to your diagram.
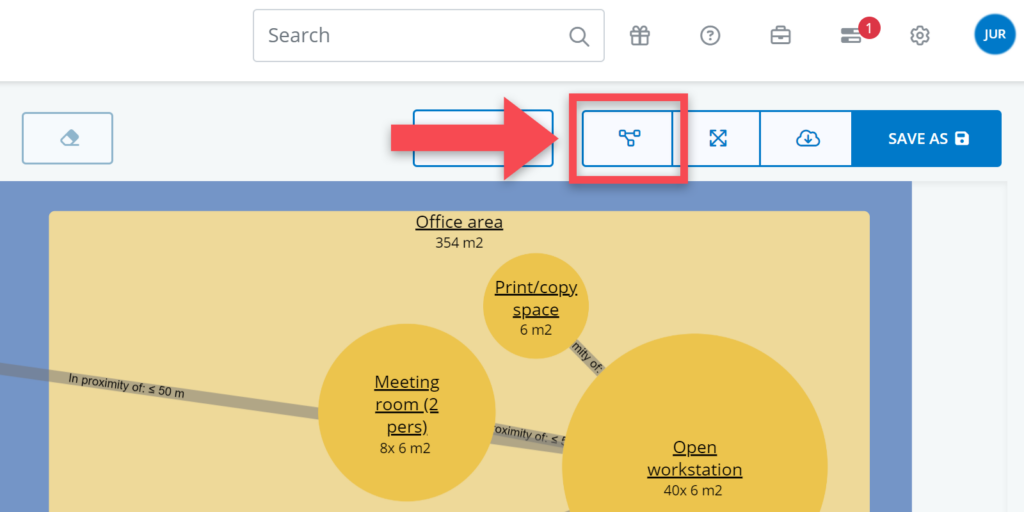
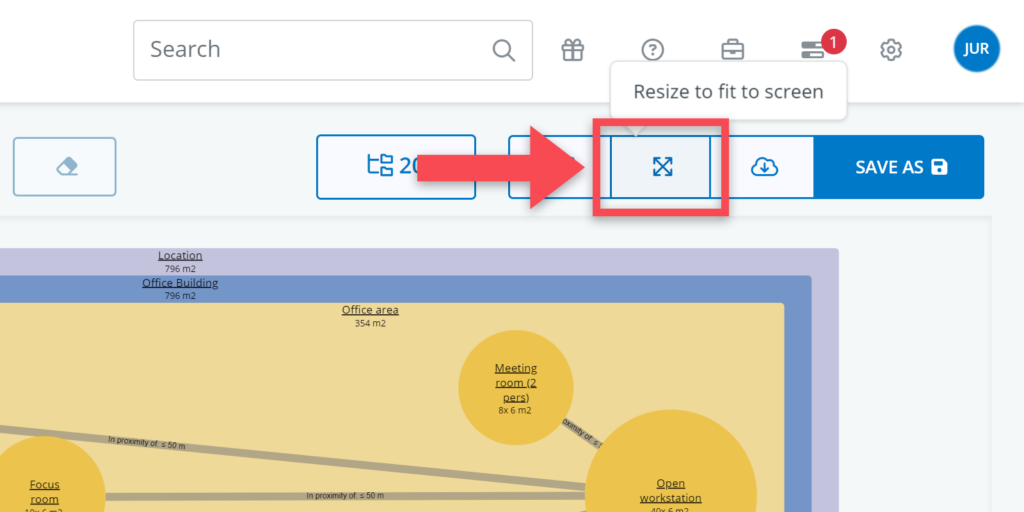
Automatically rearrange your diagram
You can rearrange your diagram by clicking on the Rearrange automatically button. This can be relevant when you have added a lot of new objects (see above) or when you have been repositioning shapes yourself but are not entirely happy with them.
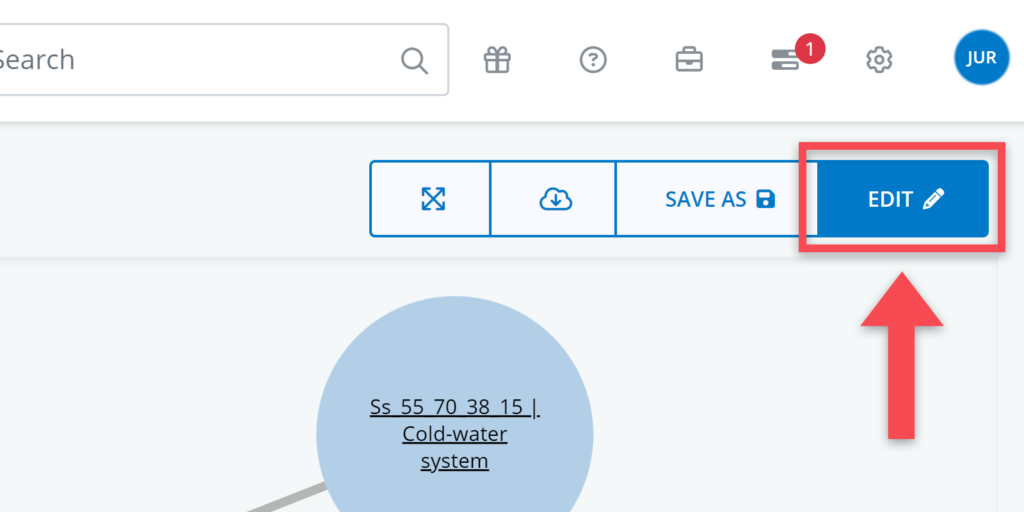
Step 4: Save your diagram
When you are finished working on your diagram, you can save the diagram by pressing the save as or save buttons at the top right of the window.
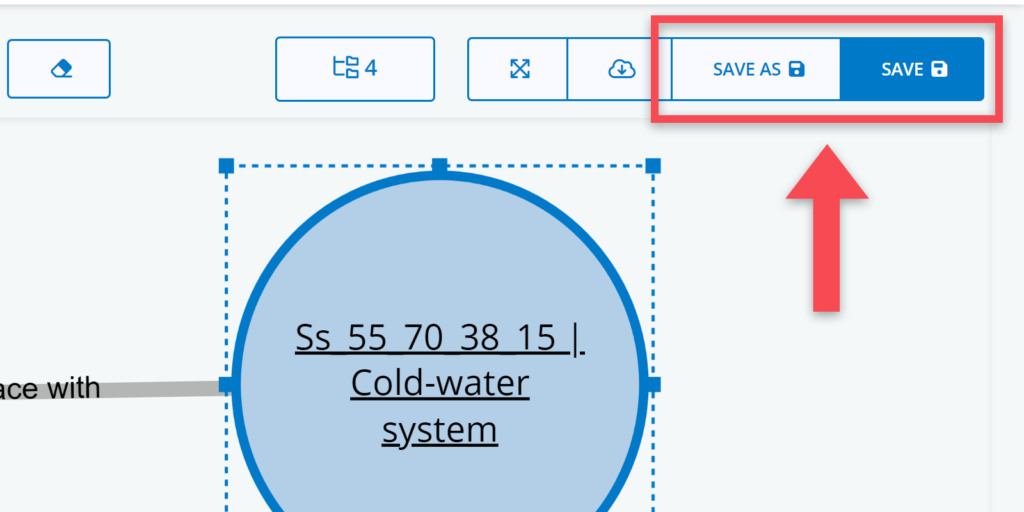
When saving as a new diagram, you will be given the option to give the diagram a name and to make your diagram available for other users.

Once you have saved your diagram, you will go back to the diagram overview.
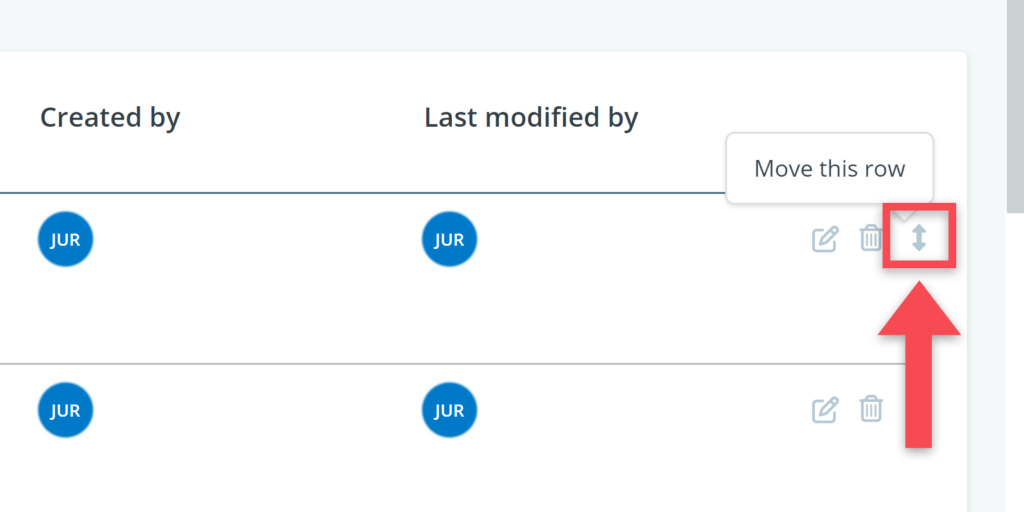
In the overview, it is also possible to change the name of a diagram and add a description. To do so, click on the pencil icon behind the object’s name.

There controls that allow you to edit (), delete (), and change the sequence of diagrams () respectively.

The sequence control () can also be used to move a diagram from the public diagram table to the private diagram table or vice versa.
Automatic updating
If there are changes in your model (e.g. changes in the names of objects or the relations between objects), these changes are automatically applied to your diagrams.
Generally, this will not affect the set-up of a diagram. There are, however, two situations in which a diagram will look different (and probably will need to be updated):
(1) Deletion of objects
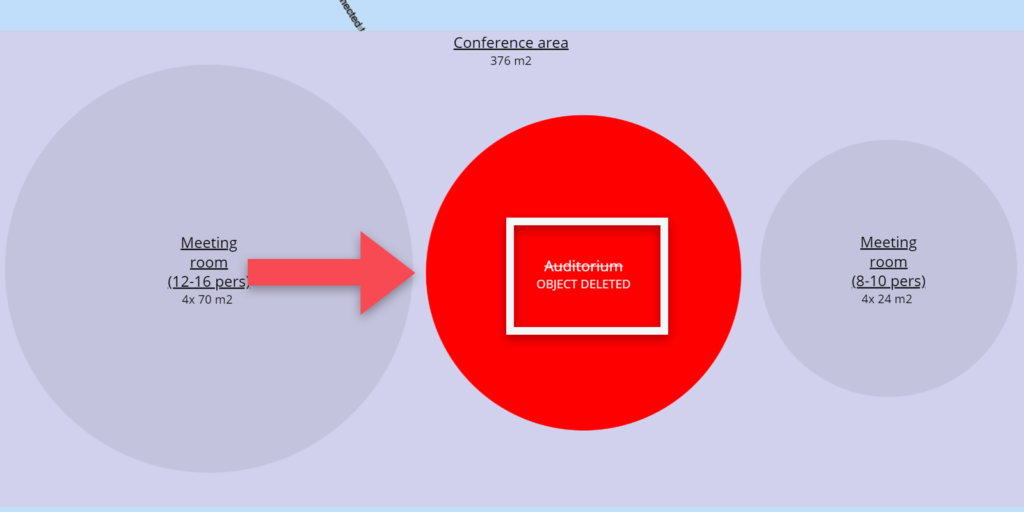
If you have an object in your diagram, and that object is later deleted from the model, your diagram will still show that original object, but it will be red and it will say Object deleted in capitals.
(2) Change of parent object
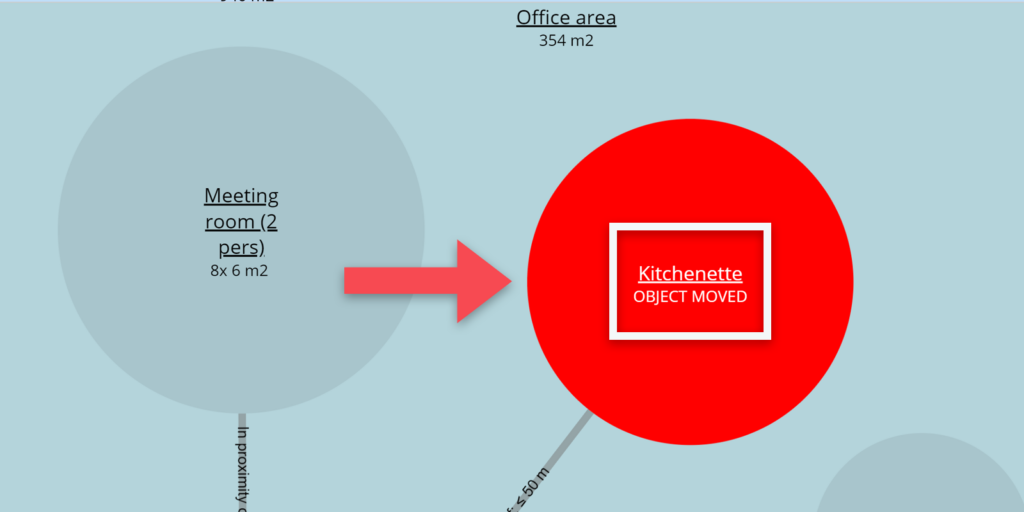
If you have an object in your diagram, that is part of a particular ‘parent object’ (e.g. a particular group of spaces or a system) and that object is later moved under another parent object, your diagram will still show that original object, but it will be red and it will say Object moved in capitals.
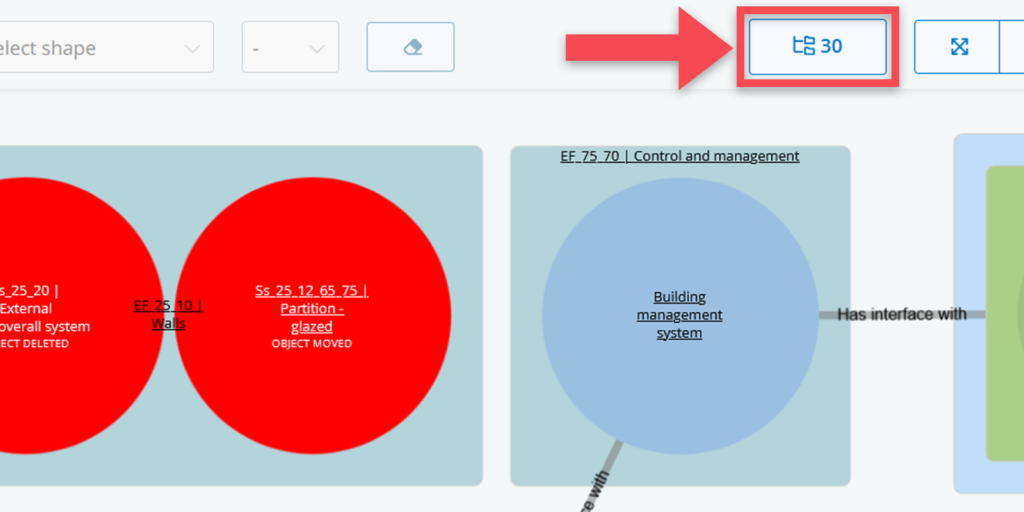
In both cases, you can remove those red objects from your diagram by doing the following:
(1) Click on the Select tree part button
(2) Keep the selection as it is and click on the Update button
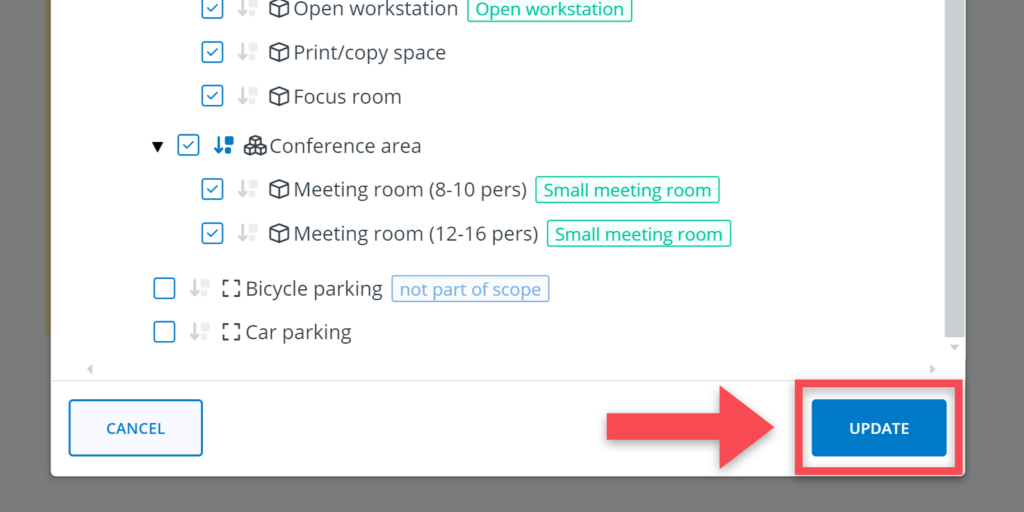
(3) Where necessary, manually reposition objects for clarity.