
In the main menu, located under Overviews, you can find the cross tables feature.
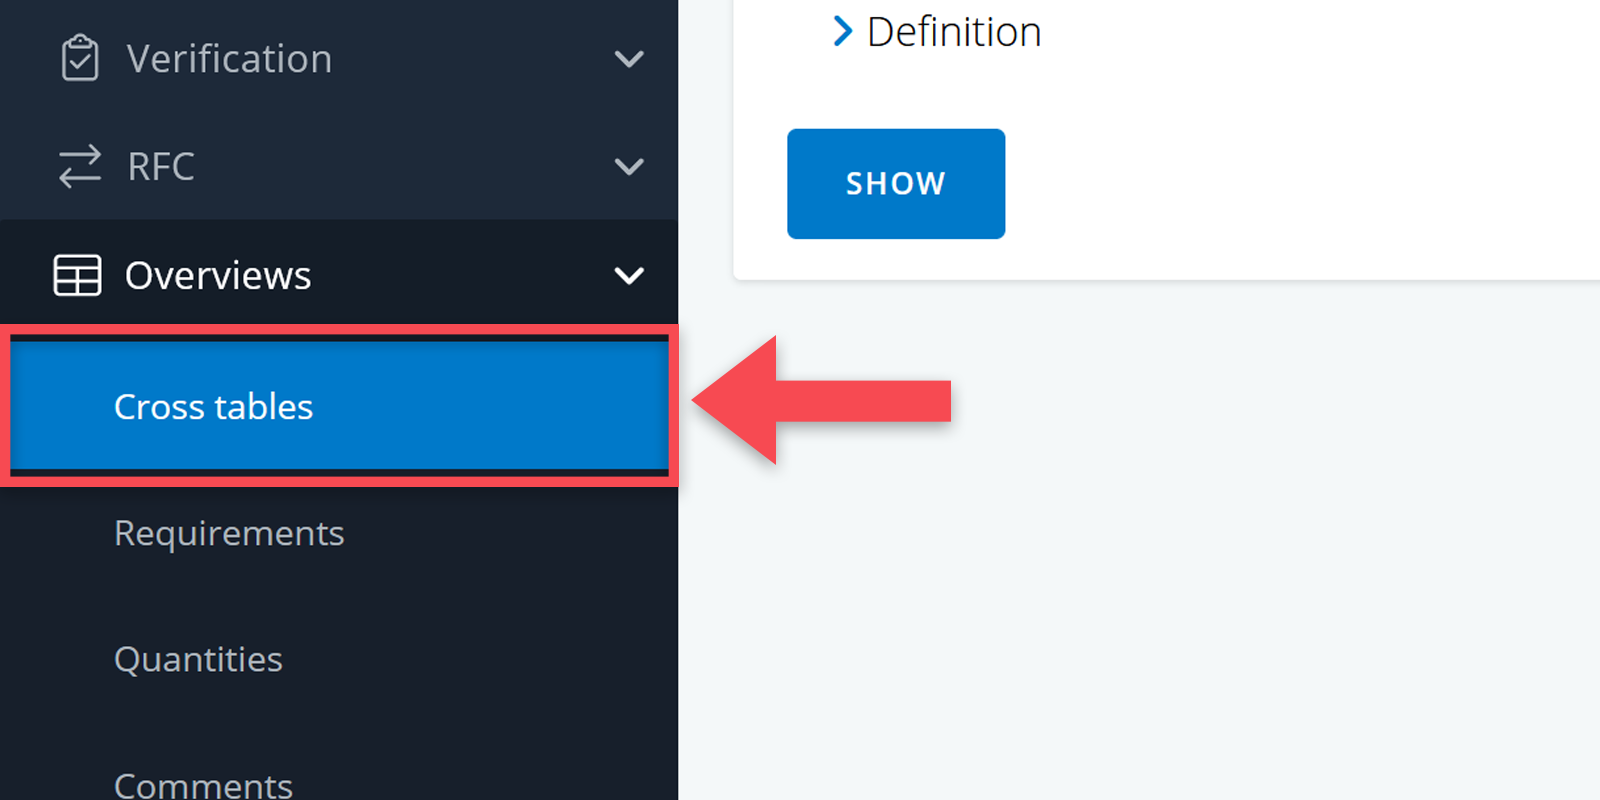
Cross-tables are tabular overviews of the requirements in BriefBuilder. These kinds of tables tend be very useful because they provide overview and because they can be edited in an Excel-like way.
In this article, we’ll explain all the ins and outs of cross tables. Would you rather just have a quick into? Then watch the video below.
Creating a cross table
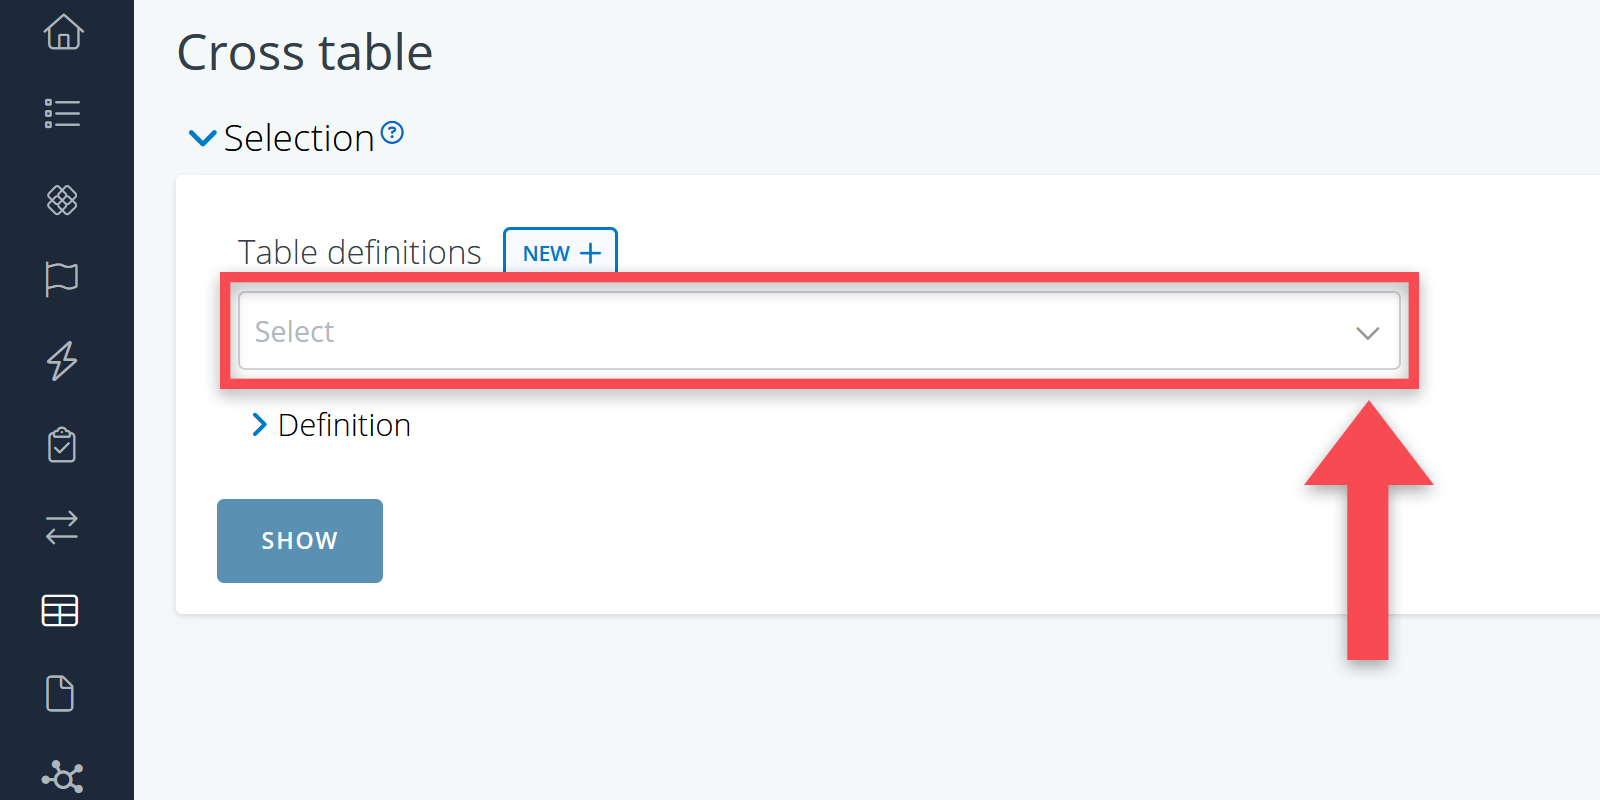
On the cross table’s selection page, you can do two things:
- Select a predefined table definition (made by you or another project participant);
- Create a new cross table.
In this article, we’ll focus on how to create a new table definition for a cross table, explaining all the possible selections.
If you want to know more about how you can save table definitions for later usage, read this article.
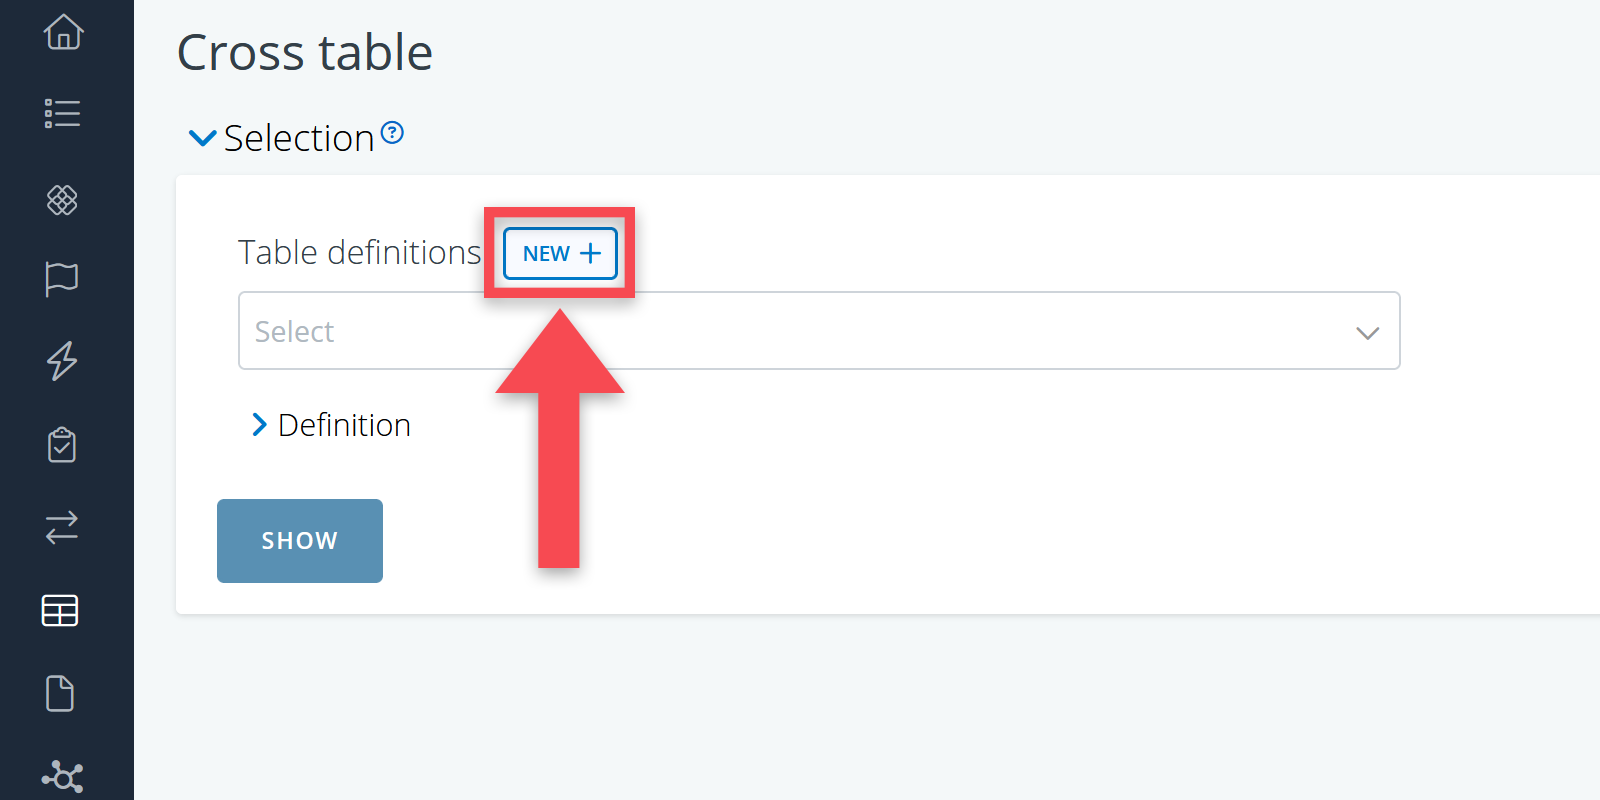
Creating a table definition
To create your own table definition, you have to click on the button New .
When creating a new table, you get to see various selection possibilities for both the table’s rows (the y-axis) and columns (the x-axis):
- For the rows, you can select a tree, a tree part, or a combination of trees. These are objects of which you want to see their requirements.
- For the table’s columns, you can select what you want to see per object, i.e. standard properties, relations with other objects, descriptions, labels, and/or files that have been uploaded for an object.
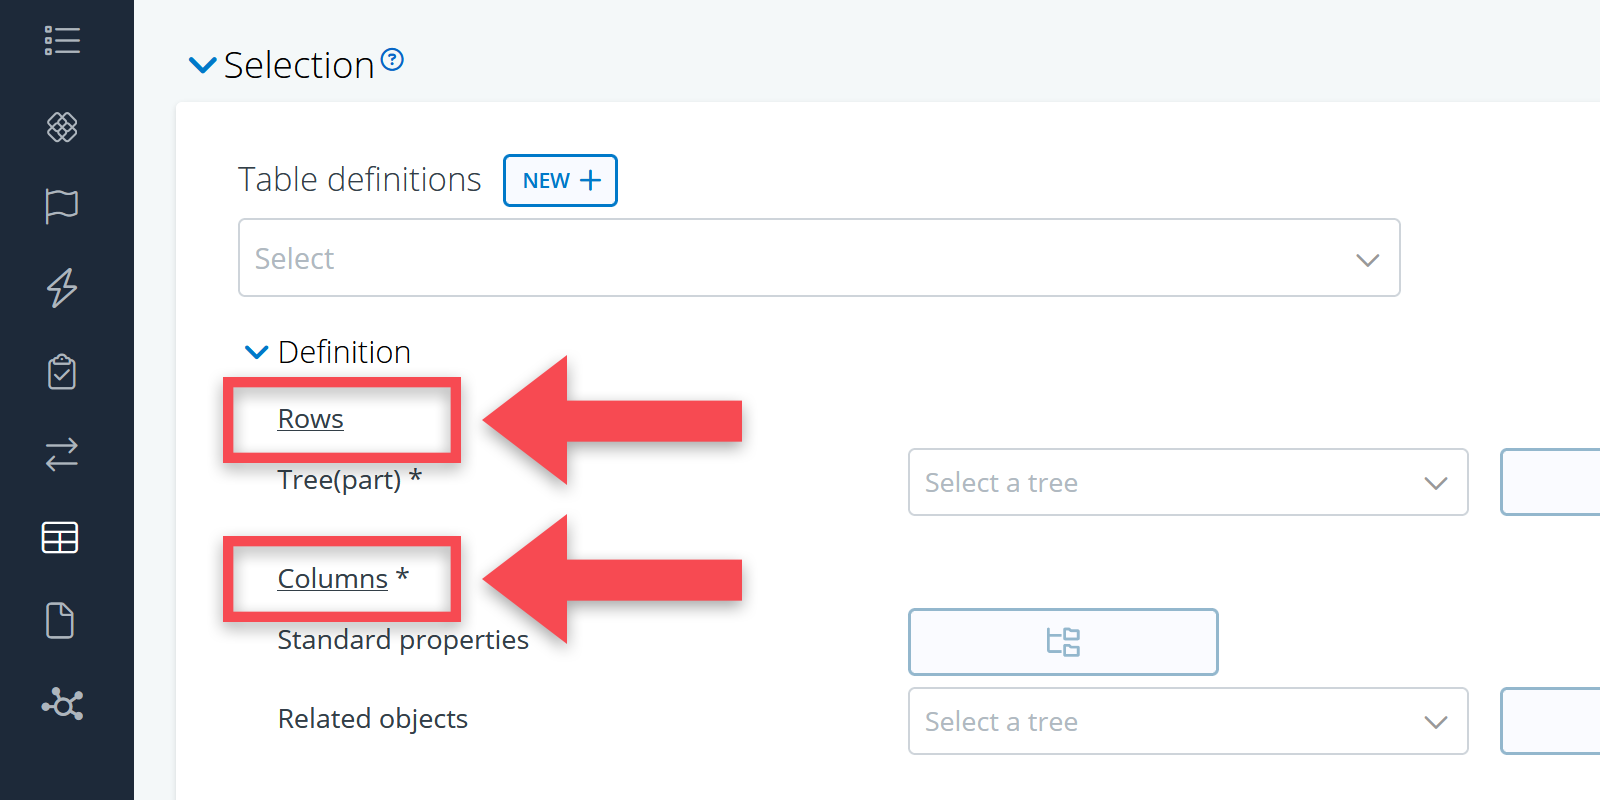
Selecting the table’s rows
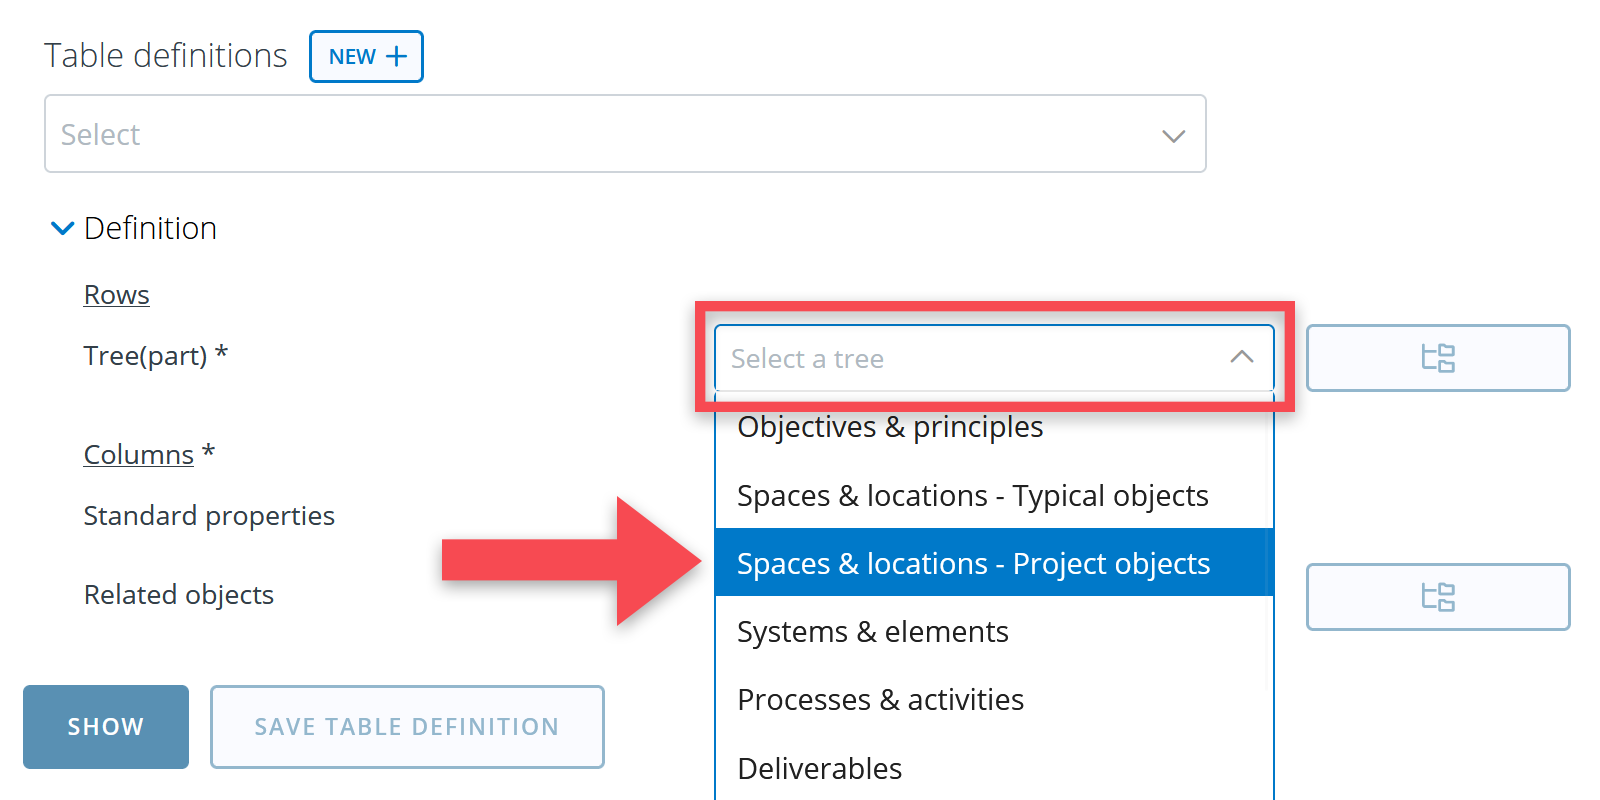
For the cross table’s rows, you first have to select the tree for which you wish to see the requirements.
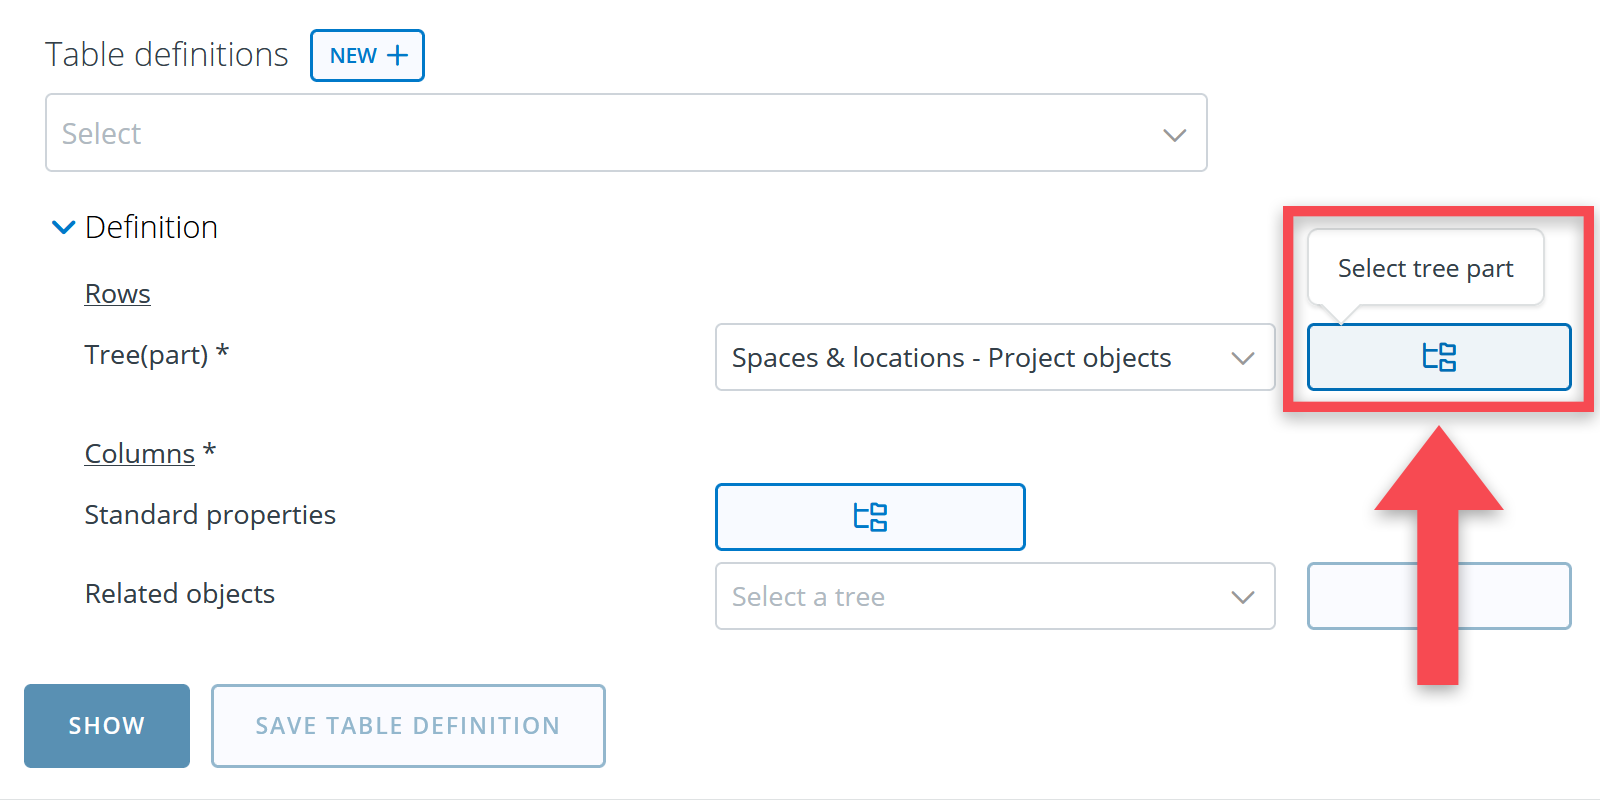
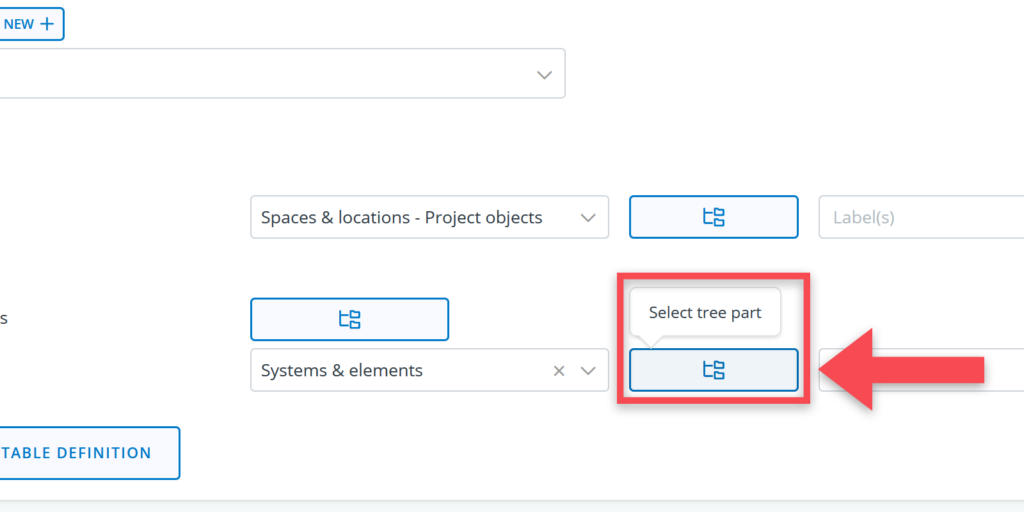
Optionally, you can use the Select tree part button to limit your selection to a specific object or group of objects (e.g. only electrotechnical objects or only particular locations in your project).
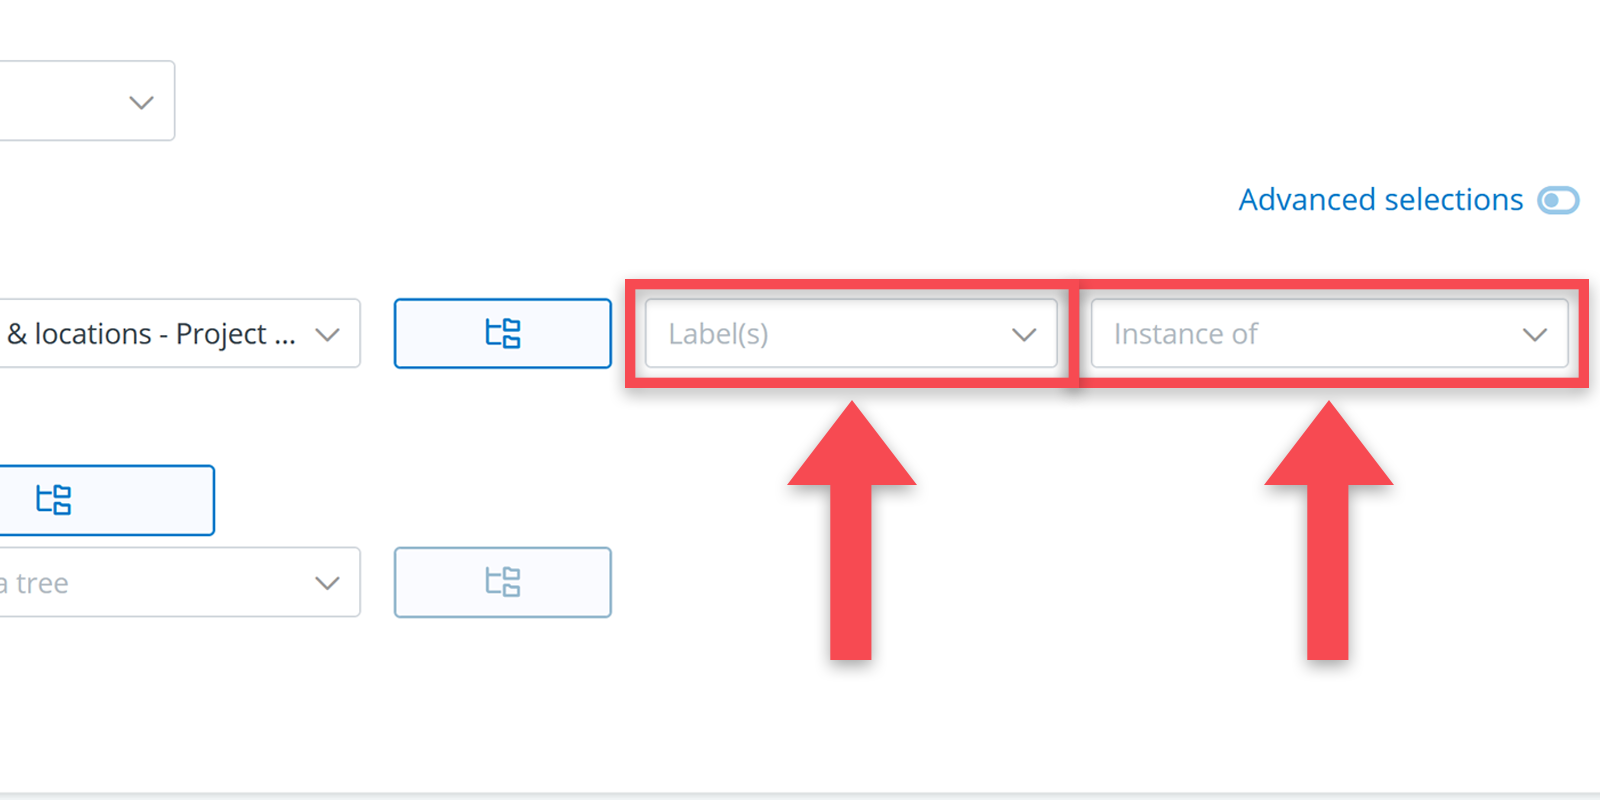
Also note that if you are using object labels and typicals in your model, you can use these as selections to narrow down your selection.
Selecting the table’s columns
The next step is to decide what type of requirements you wish to see as columns. Most often, you will want to see standard properties and/or relations to other objects.
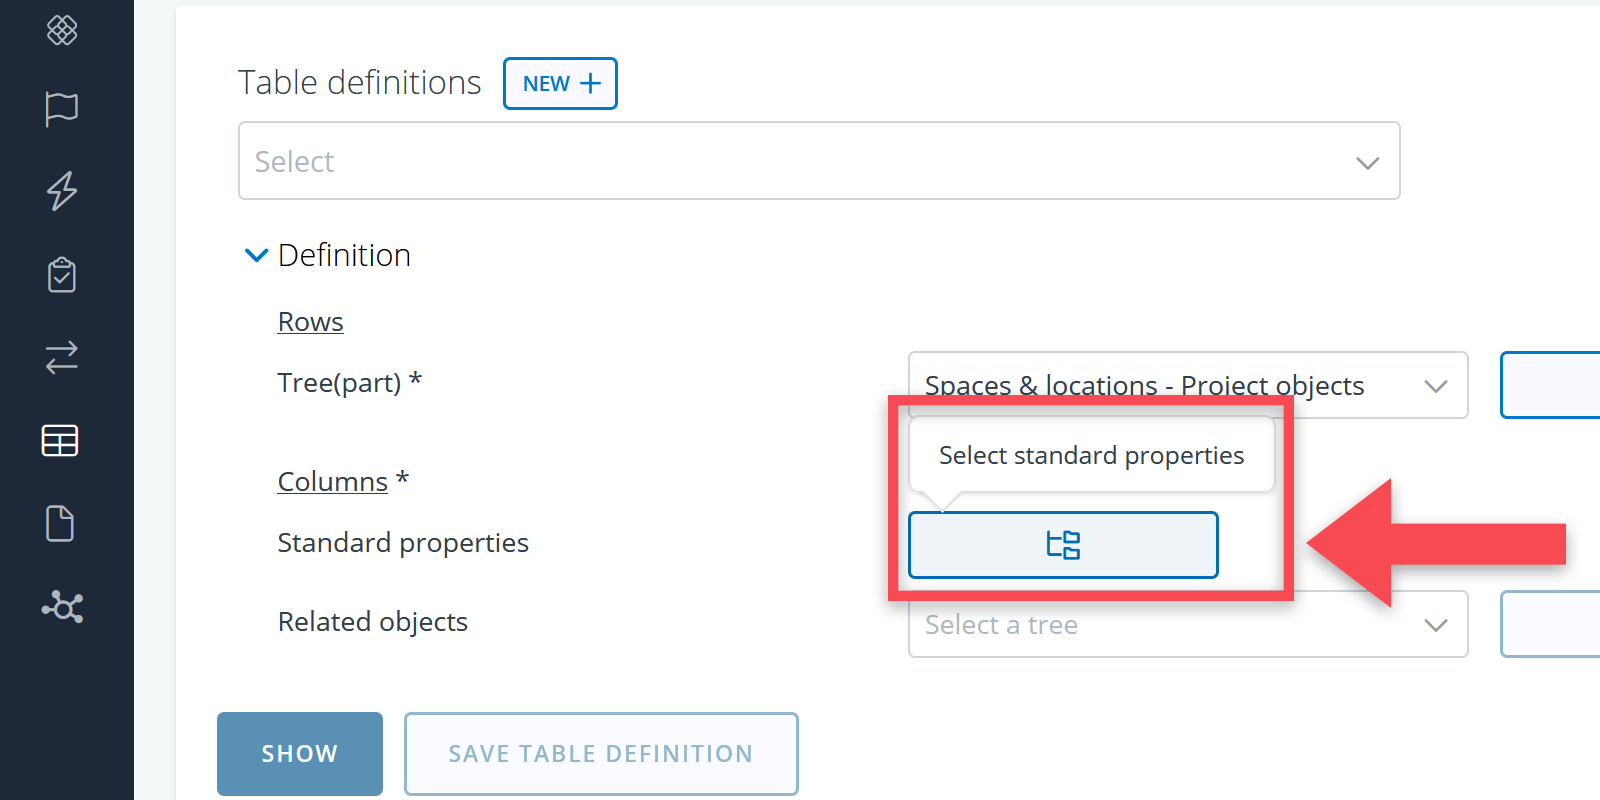
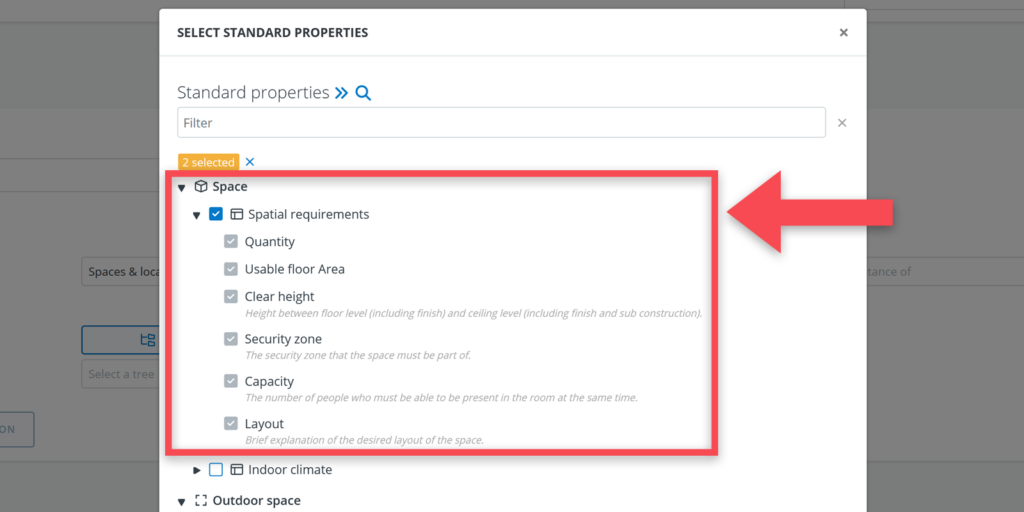
Standard properties
For the standard properties, you can either select individual standard properties or entire property tables. The latter can be done by using the icon.
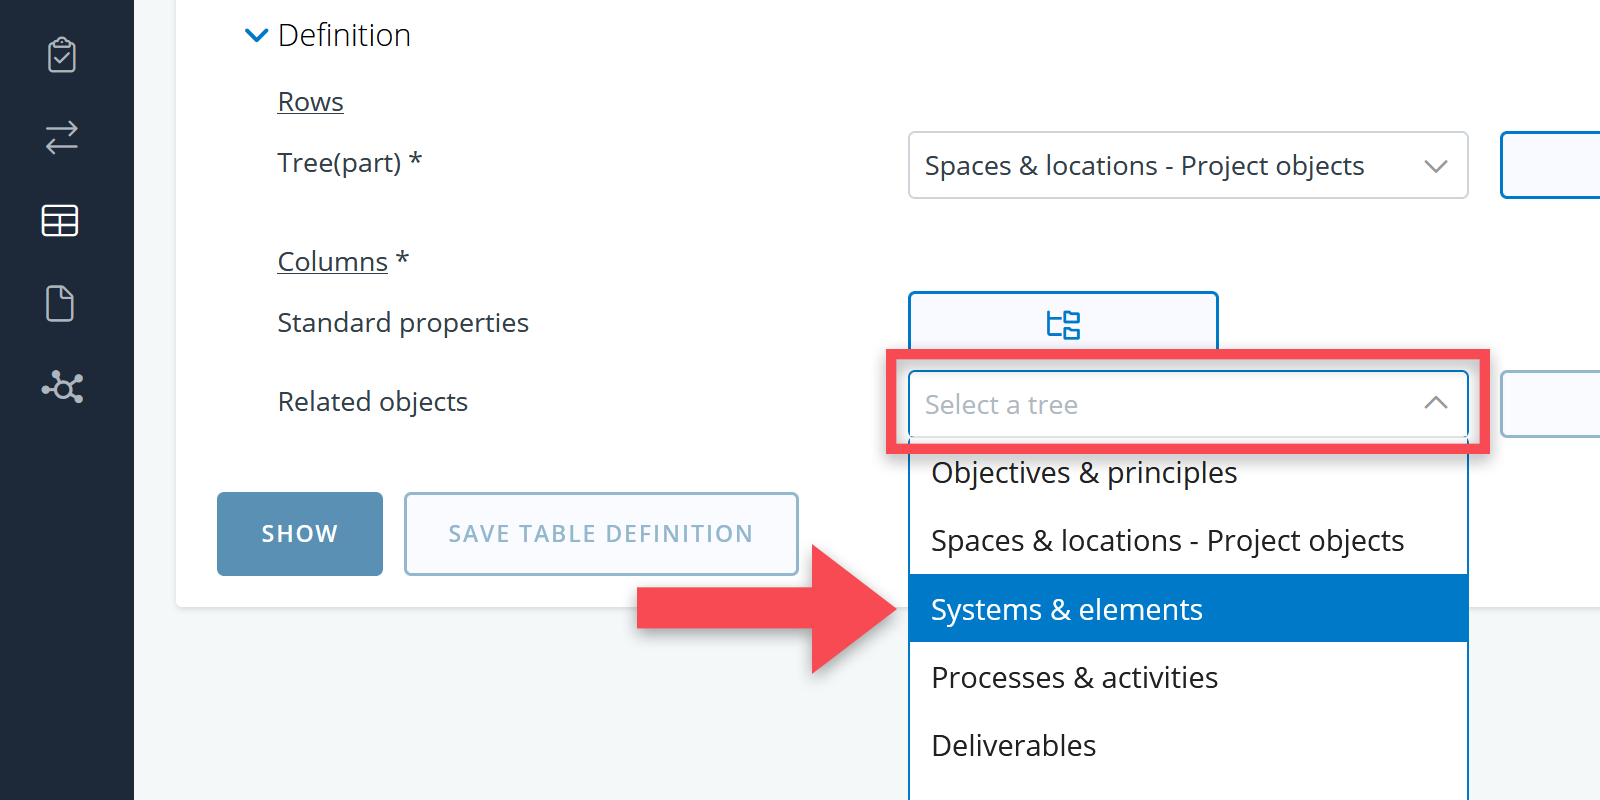
Related objects
The related objects selection is used to select a tree containing objects that have relations with the objects in the tree selected for rows. The crosstable then displays the relationships between objects from the two selected trees.
To display relations within a single tree, select the same tree for both rows and columns.
For example, if you have chosen Spaces & locations tree for the rows, you may want to select the Systems & elements for the columns to see which elements are placed in which spaces.
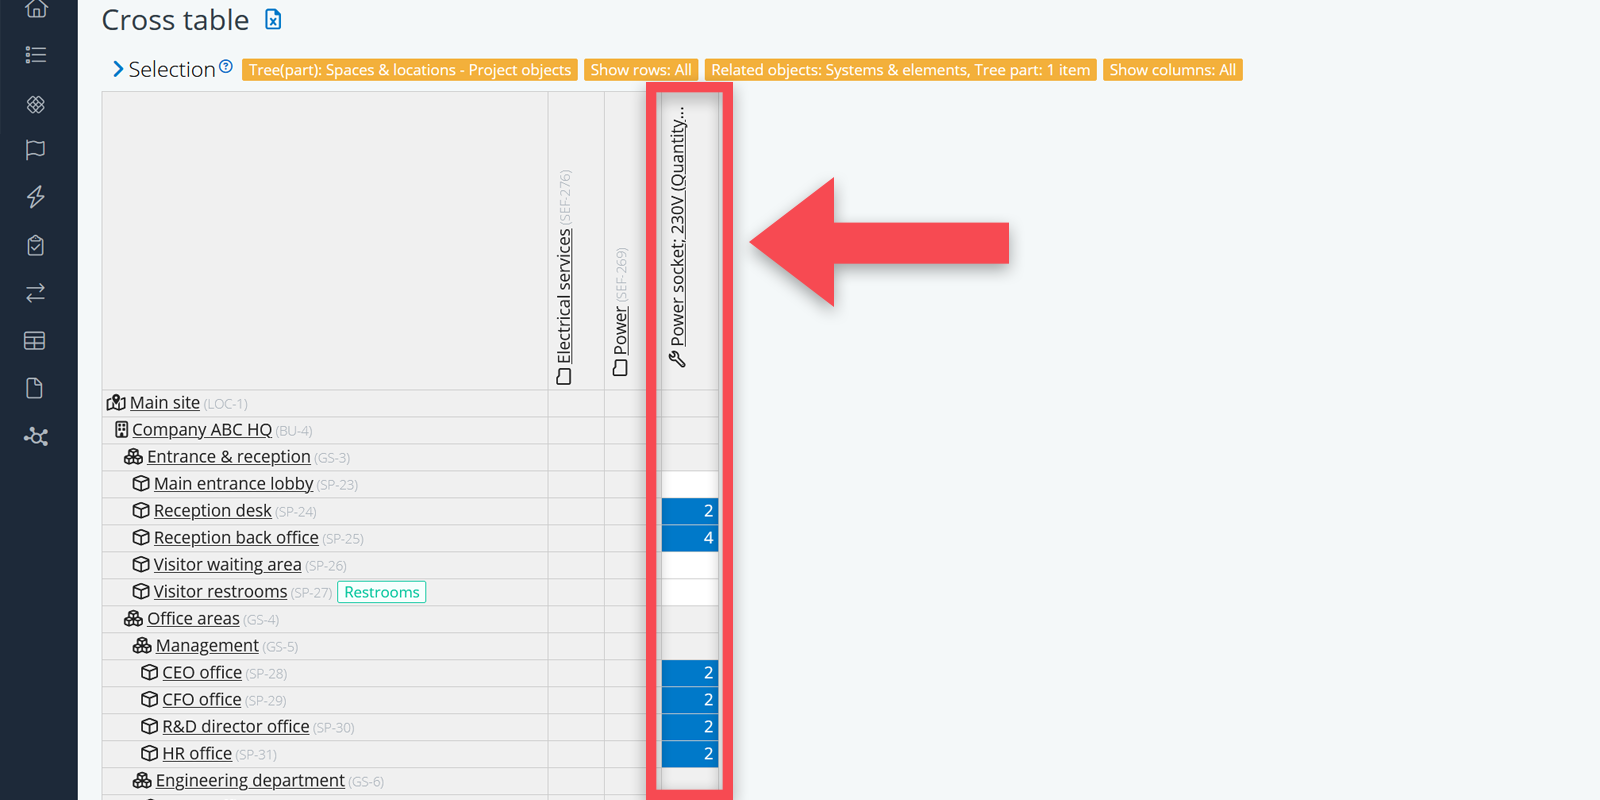
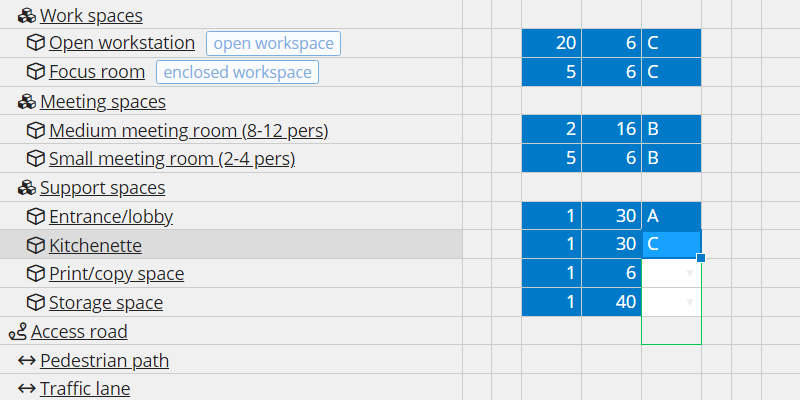
Example of a cross table showing the required number of power outlets per space. The selections for this table are: the tree Spaces & locations (for the rows), the tree Systems & elements (for the columns) and the tree-part (in this case a single object) Power outlet.
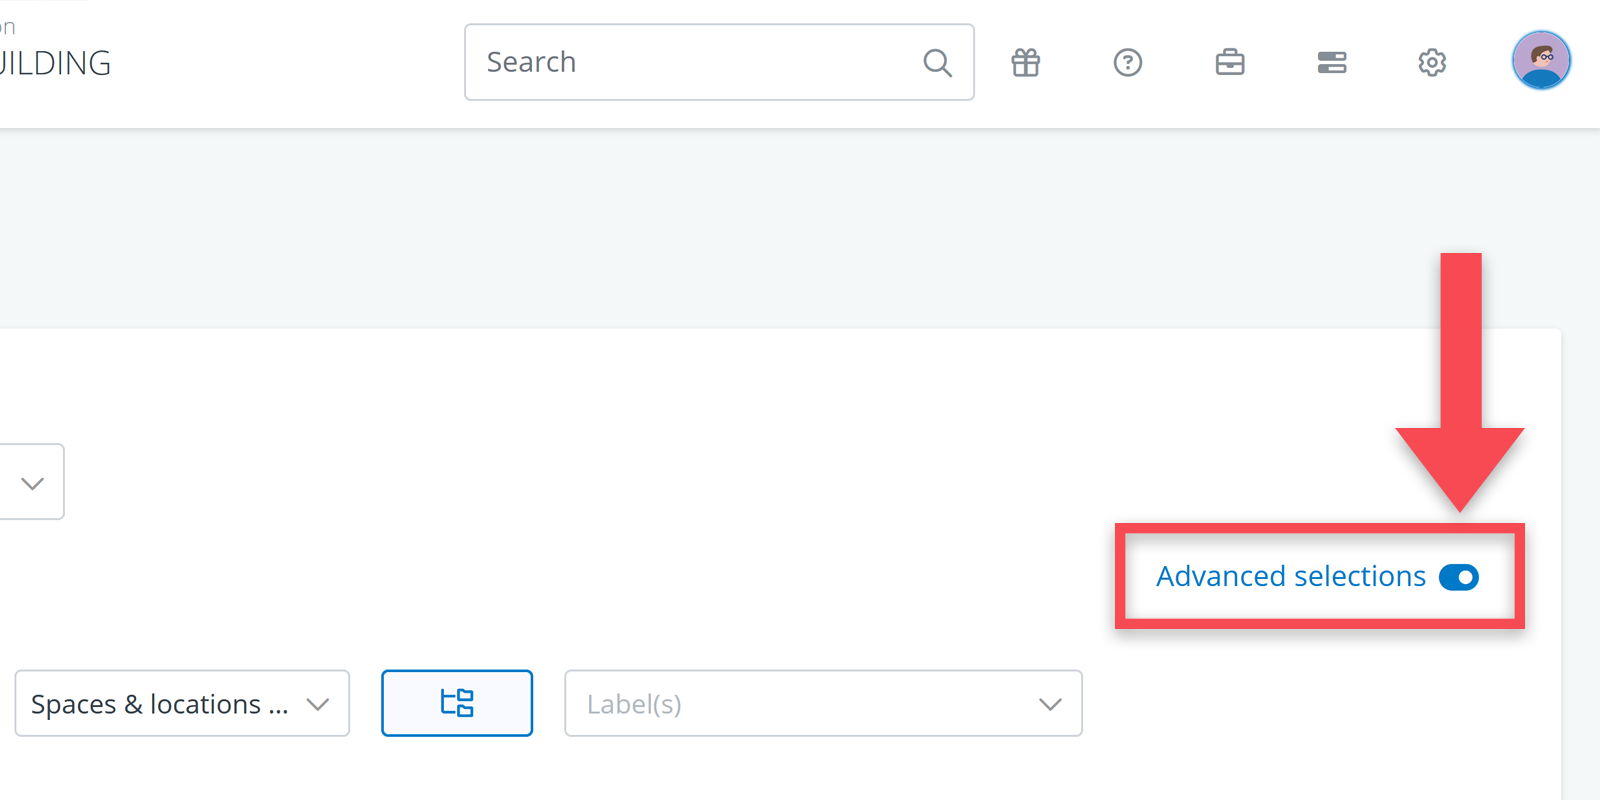
Advanced options
Under advanced options, you will find a couple of extra options for your cross tables. We’ll explain them below.
Combine two trees for the y-axis
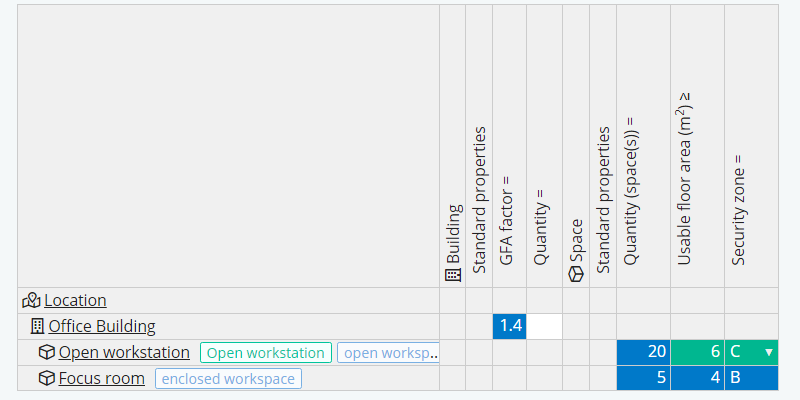
Combining two trees on the y-axis may sound complex, but it can be very practical. It can, for example, be useful to show both the spaces and the user equipment that has to be placed in those spaces as rows. See example below.
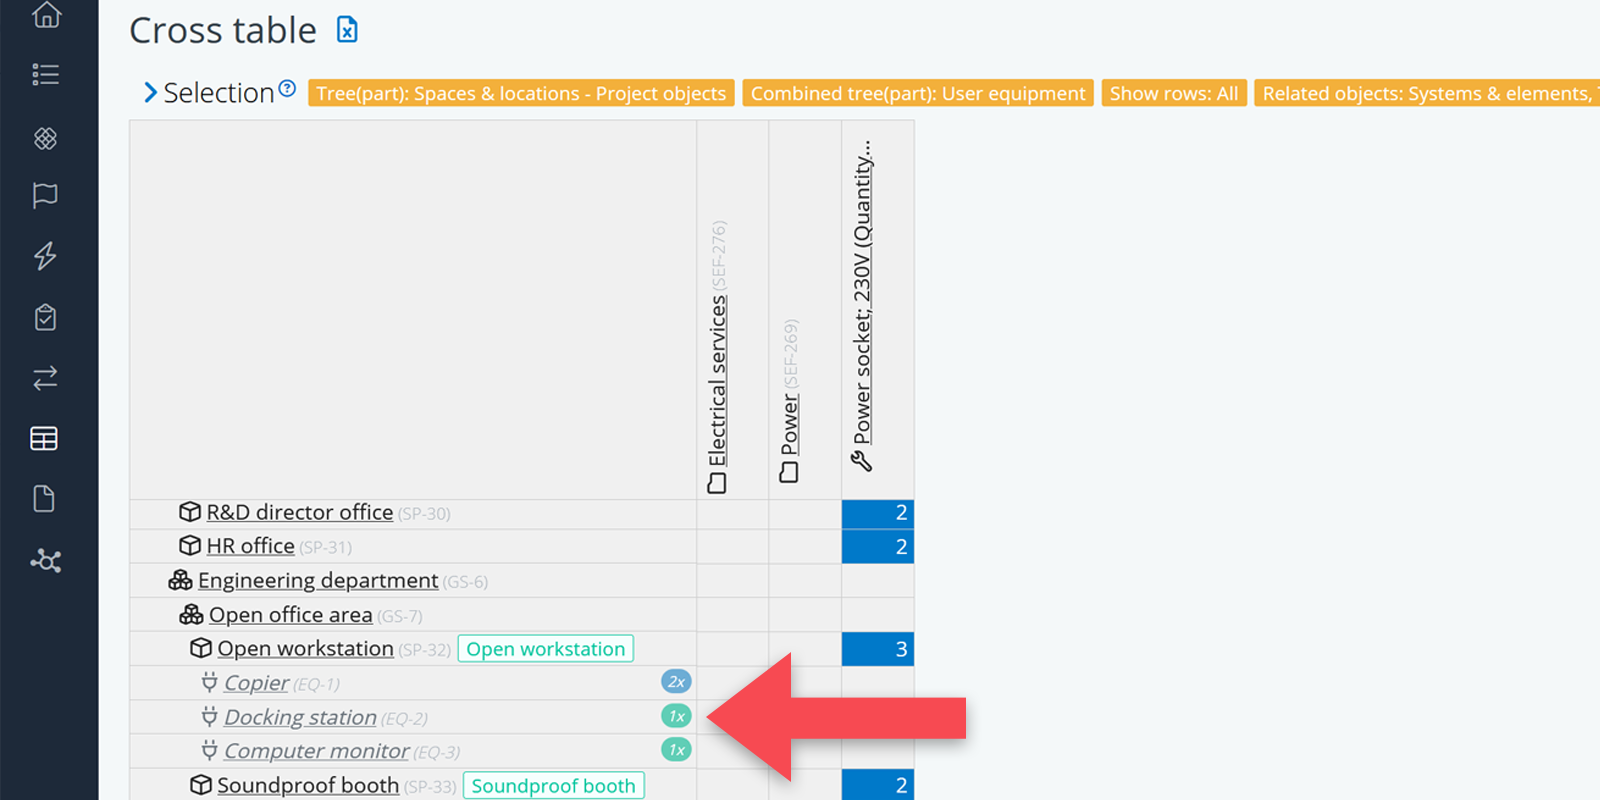
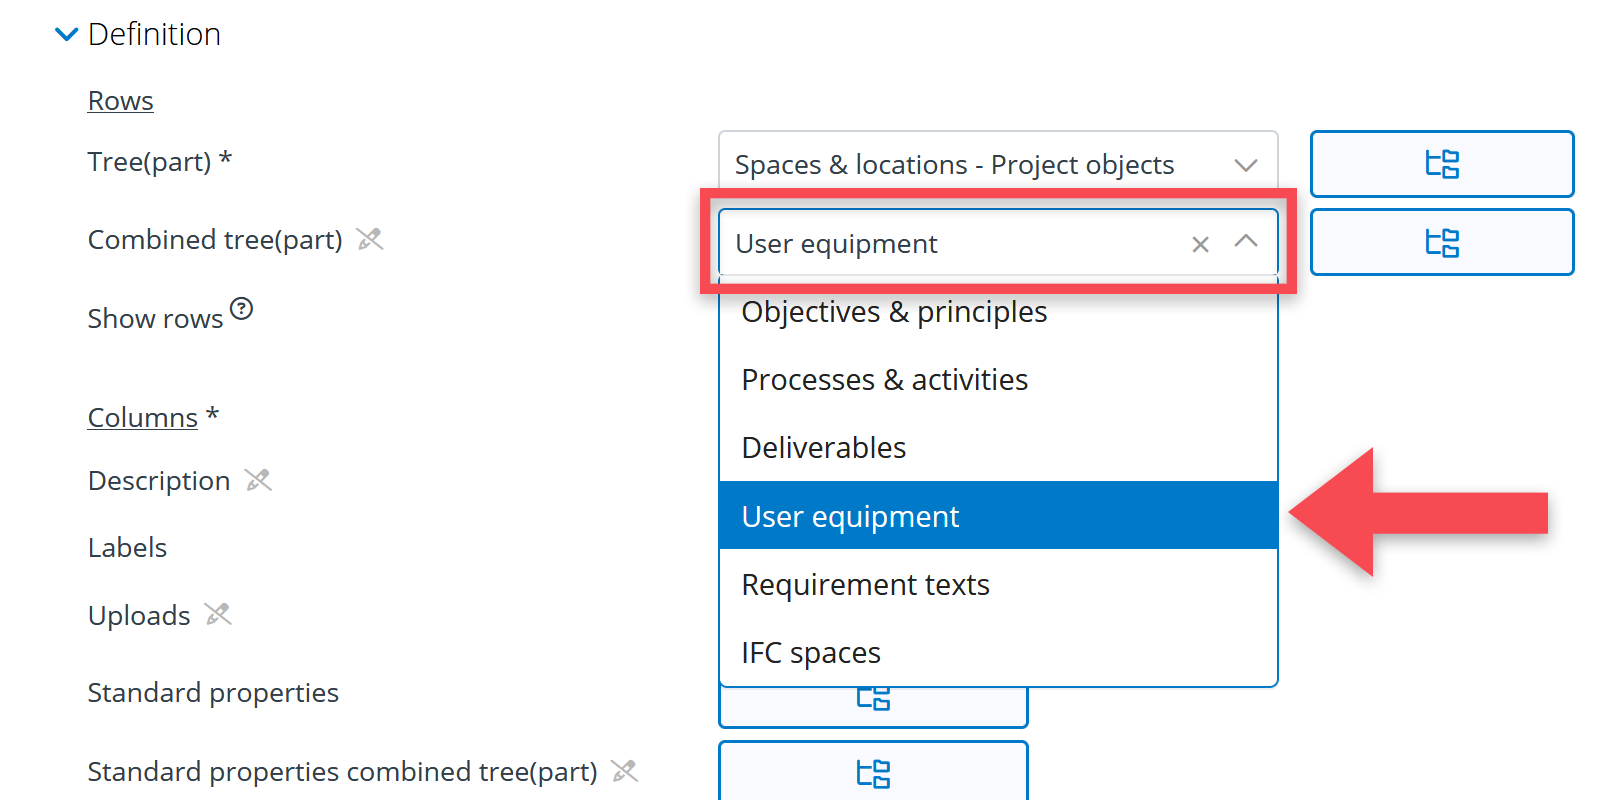
To create this overview, you have to select Spaces & locations as your main tree and User equipment as the Combined tree(part). See below.
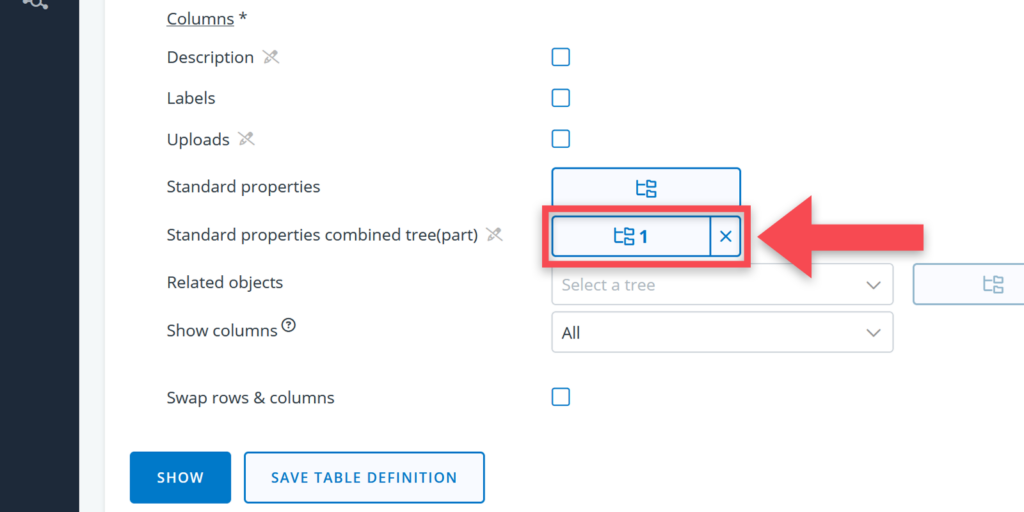
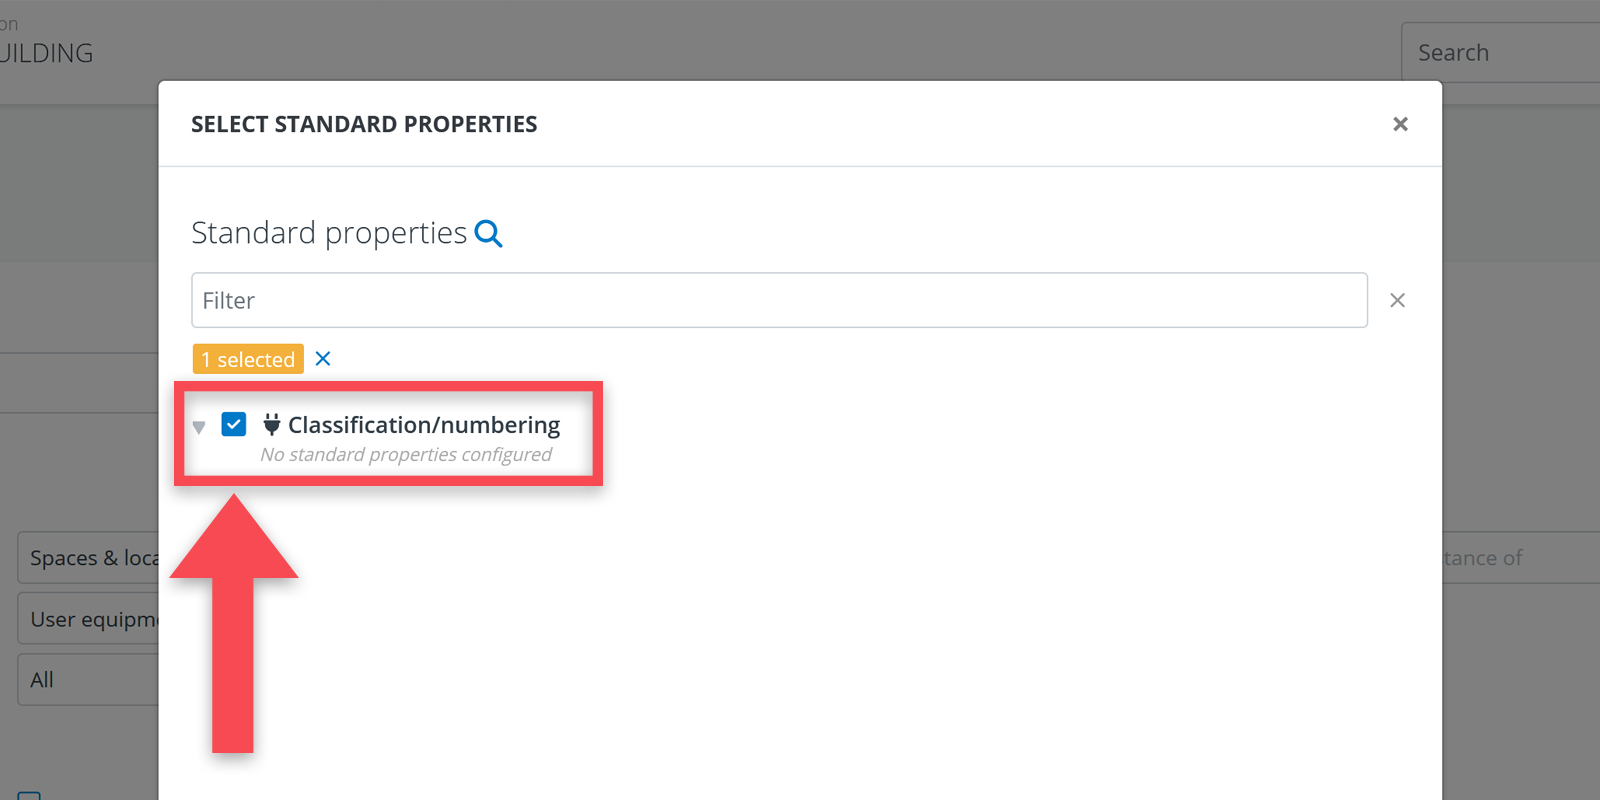
Additionally, properties of objects from the combined tree can be included in the crosstable. This option is available under Columns as Standard properties combined tree(part).
Show rows/columns value filter
The Show rows and Show columns filters allow precise control over which rows or columns appear in the cross table, based on whether they contain values or are empty.
These filters help users narrow down or highlight specific data, making it easier to focus on relevant requirements, detect missing information, or identify requirements or relations that need attention.
Users can select from the following options for filtering rows or columns:
- All
Displays all rows or columns regardless of whether they have values or not. - With one or more empty values
Shows only those rows or columns that contain at least one empty (missing) value. - With empty values only
Displays only rows or columns where all values are empty. - With at least one value
Shows rows or columns that have at least one populated value. In other words, the table will not contain any empty rows or columns.
For example, to quickly find all systems and elements that are not (yet) linked to any space or location, a user can create a crosstable with spaces & locations in the rows and systems & elements as related objects in the columns. Then, by setting the Show columns filter to ‘with empty values only’, the table will display only the systems and elements without any relation to the selected spaces and locations.
Include descriptions
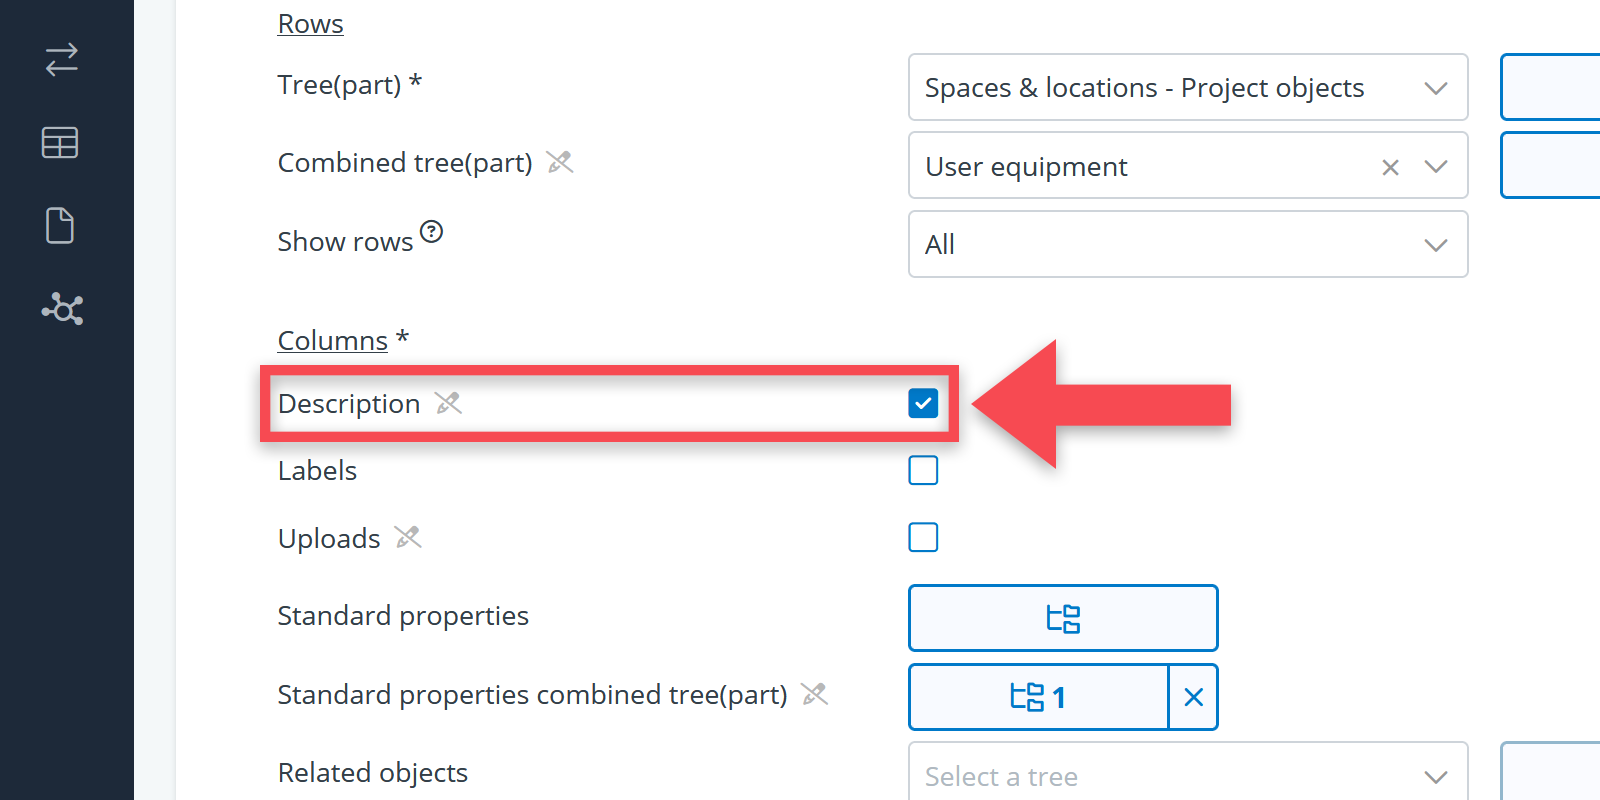
When you want to have the objects’ descriptions as column in your table, you just have to check the Descriptions box under the header Columns.
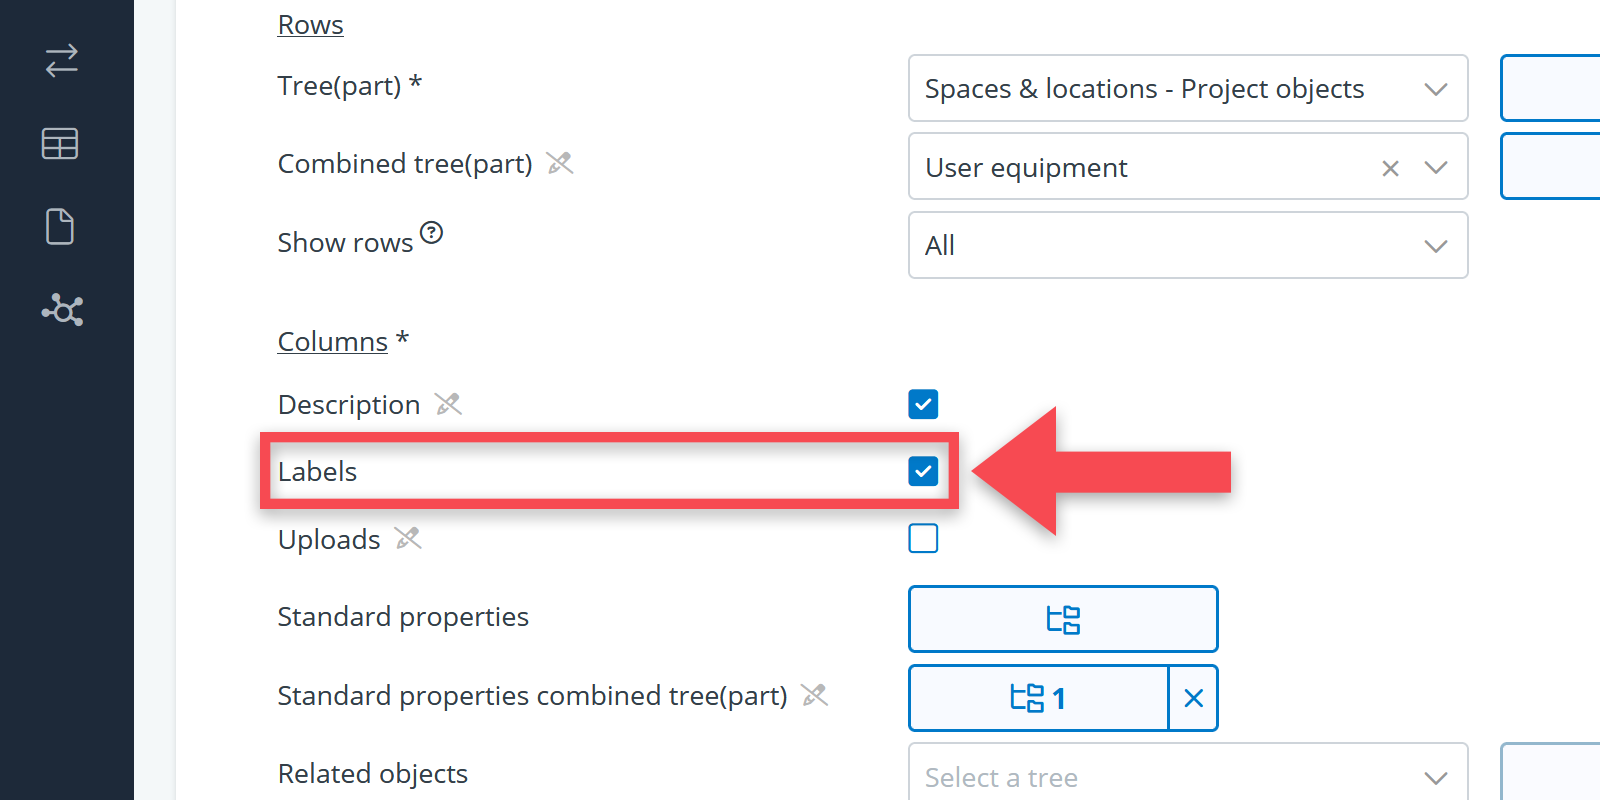
Include labels
To include the objects’ labels as column, you must check the Labels box under the header Columns.
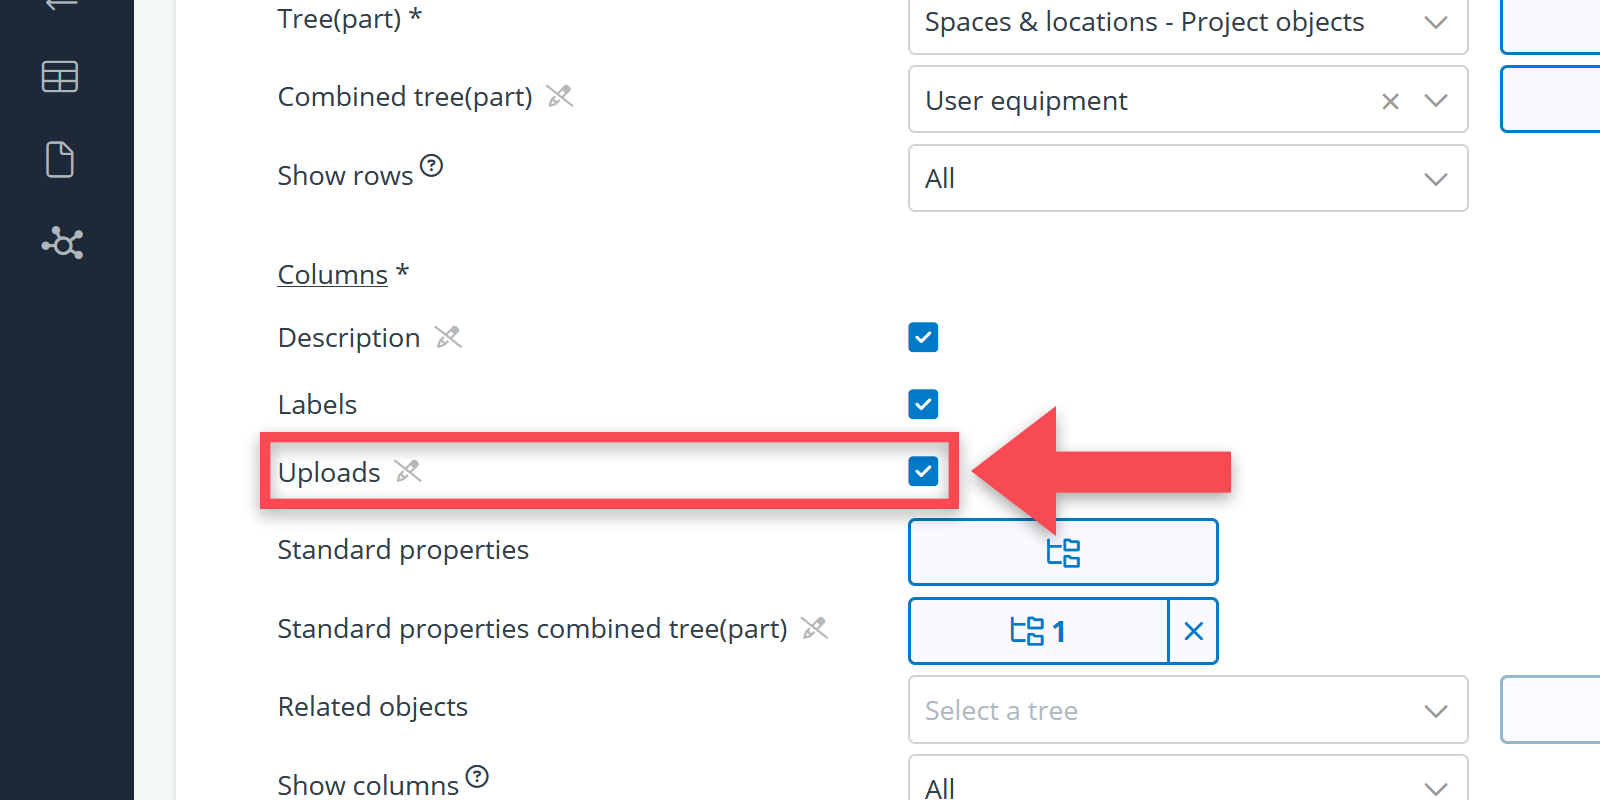
Include uploads
To get an overview of all the uploads per object, tick the Upload box.
Saving your table definitions
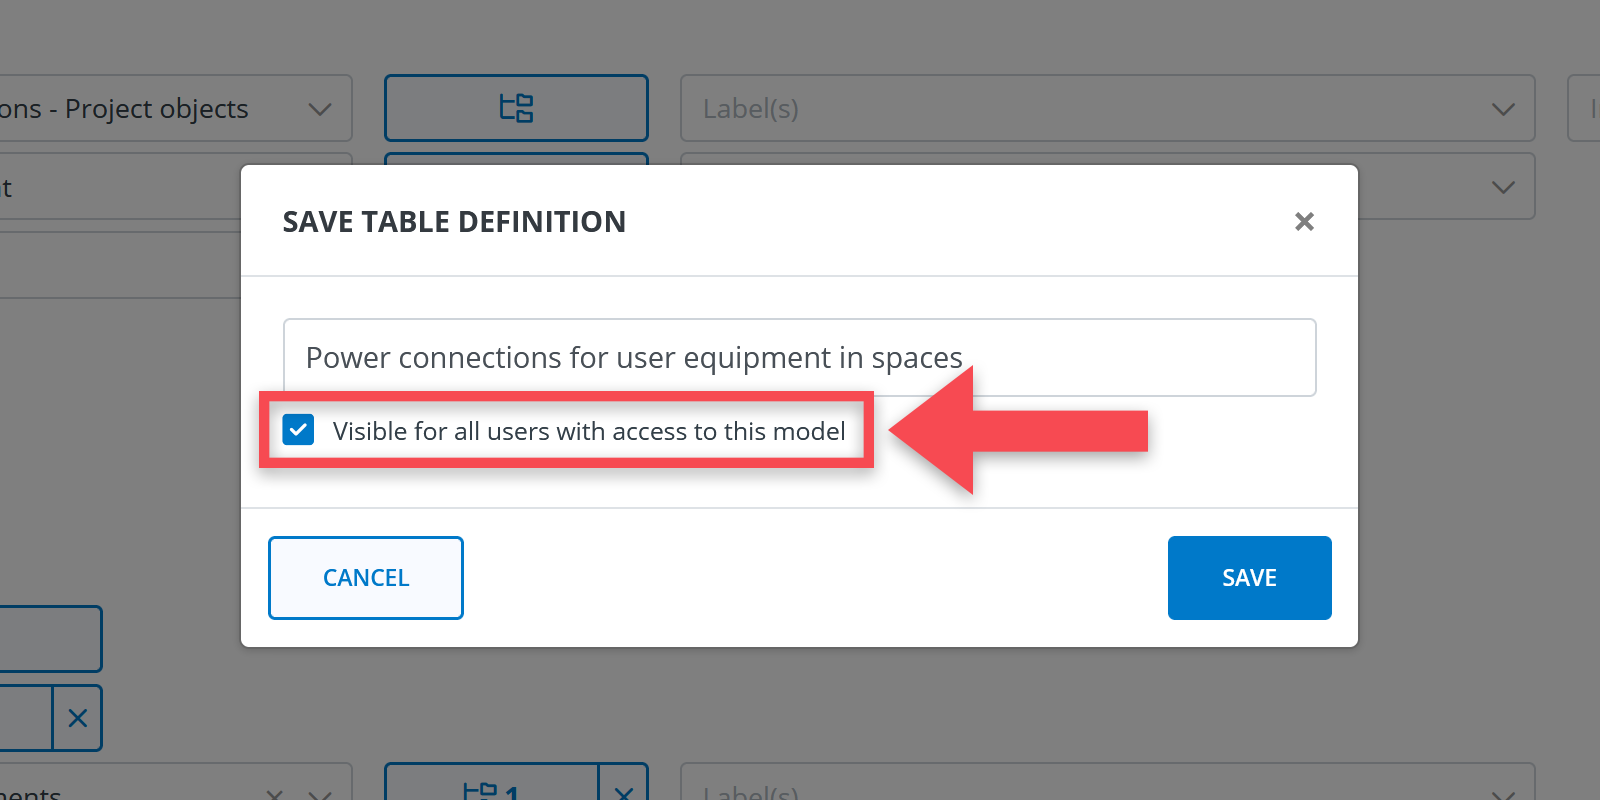
Once you have defined your table set-up, you can save it for later use. For this, you have to click on the button Save table settings.
Depending on your role and its permissions, you choose to save the table definition for your own use or for it to be accessible for all the model’s users.
For the latter you have to check the box Visible for all users of this model.
More explanation about table definitions can be found here.
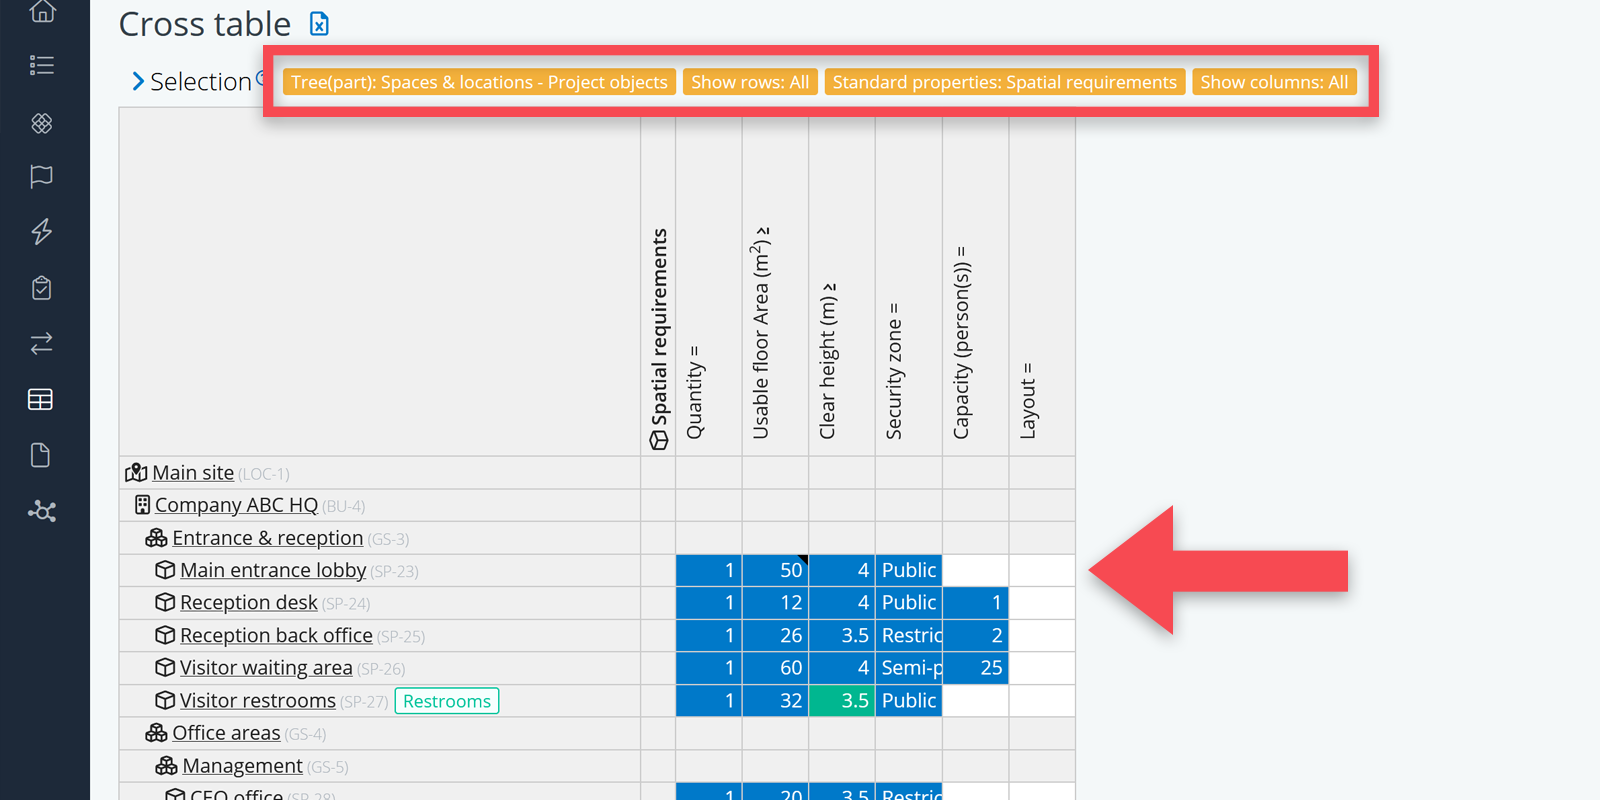
Table legenda
The cross table users color to indicate whether there is a relation or a property value present. The color coding is as such:
- Grey: cells where a relation or property value is not possible/not allowed
- White: cells that are empty, but where you can enter a relation or a property value
- Blue: cells where there is a relation or a property value present
- Green: cells where there is a relation or property value present inherited specifically from a typical object
Editing in the table
Cells can be edited in the following ways:
- Typing in a value (quantity/distance in case of relations)
- Deleting a value (quantity/distance in case of relations)
- Double clicking on a cell (relations only: it creates a relation, without a quantity/distance)
- Clicking on your delete button when having a cell selected
Copying data to multiple cells
You might want to copy particular requirements (properties/relations) to multiple cells. You may, for example, want to apply the same indoor climate requirements to all the spaces in your selection.
You can do that in two ways:
(1) You can “drag” the value of a cell:
- Select the cell (or multiple cells)
- Move your cursor to the little blue corner (lower corner on the right side)
- Click on that and hold on to your mouse button
- Drag the value to the cells where you want to have the same value
(2) You can use the well-known CTRL-C / CTRL-V short cut.
- Select the cell (or multiple cells)
- Click on your CTRL button and the letter C (simultaneously)
- Select the cell (or multiple cells) where you want to have the same value
- Click on your CTRL button and the letter V (simultaneously)
Download as Excel
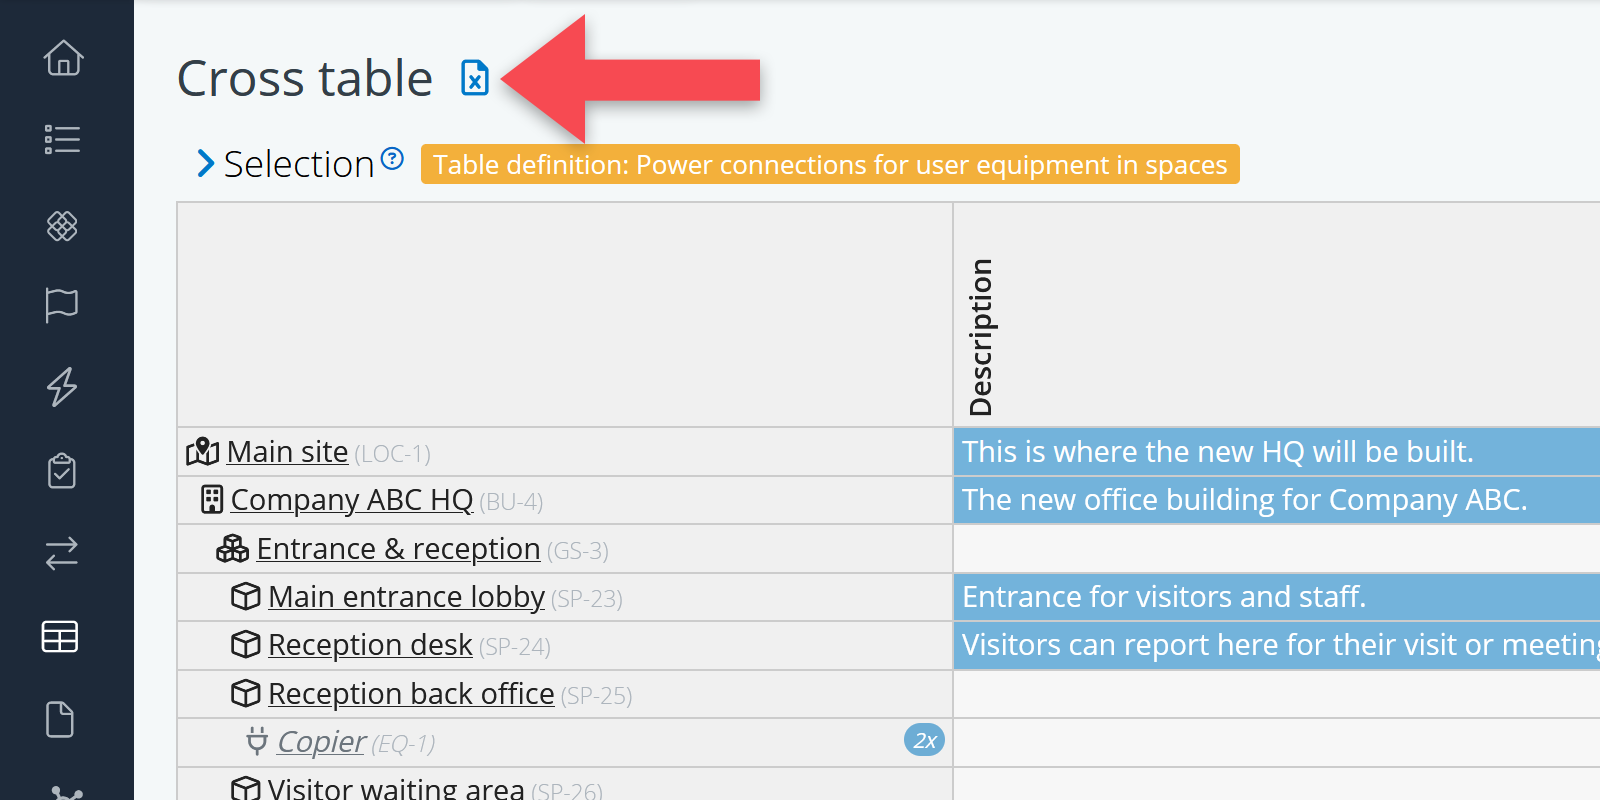
You can download the table in Excel format by clicking on the icon, right next to the table’s name.
Depending on the size of the overview, it may take some time to download the file. You can find the file in the Downloads folder of your computer. For more info on Excel reports, click here.
Some examples
See below for some examples of commonly used cross tabels and how to make them.
Indoor climate table
In building projects, indoor climate experts usually prefer to see their requirements in a tabular way. To create such overviews, do the following:
- Select Spaces & locations for Tree(part)
- Select the relevant property table (e.g., acoustics) for Standard properties
- Click on Show
Placement table
In both infrastructure and building projects, it will be useful to see where technical systems/elements are placed spatially. To create an overview of this, do the following:
- Select Spaces & locations for Tree(part)
- Select Systems & elements for Related objects
- Click on Show
Security zoning table + cameras
In a building project, you may want to check your security zoning requirements against the requirements for the placement of cameras. To create an overview of this, do the following:
- Select Spaces & locations for Tree(part)
- Select the relevant property table (the one with Security zoning) for Standard properties
- Select Systems & elements as for Related objects.
- Use the Select tree part button to select the object Security camera
- Click on Show
Adjacency matrix (aka ‘proximity chart’)
How should a project’s different spaces, or buildings, or locations be positioned in relation to one another? You can make a diagram of this (see here), but also a matrix. For this, do the following:
- Select Spaces & locations for Tree(part)
- Also select Spaces & locations for Related objects.
- Click on Show