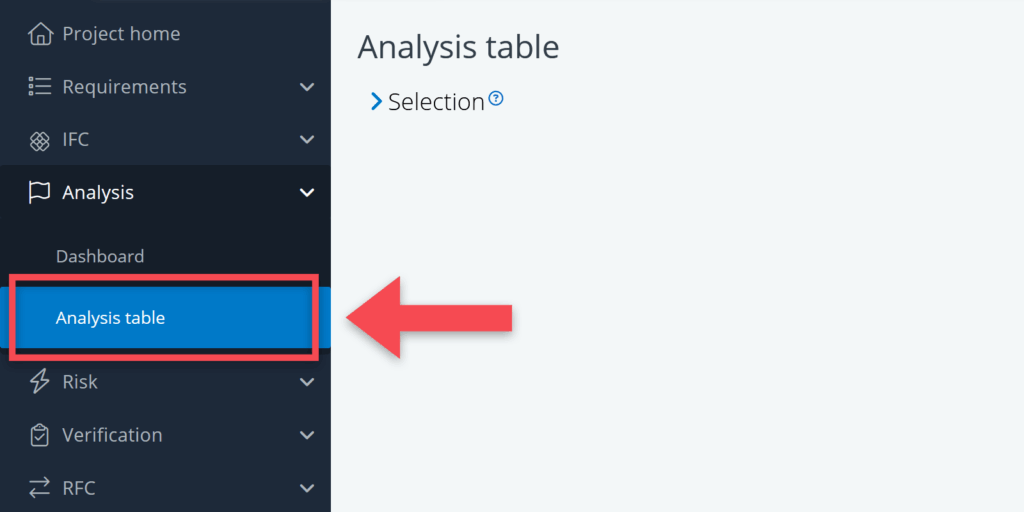
In the analysis table you can capture and view the model’s requirements analysis data in a tabular view. The analysis table can be found under the Analysis heading in the main navigation menu.
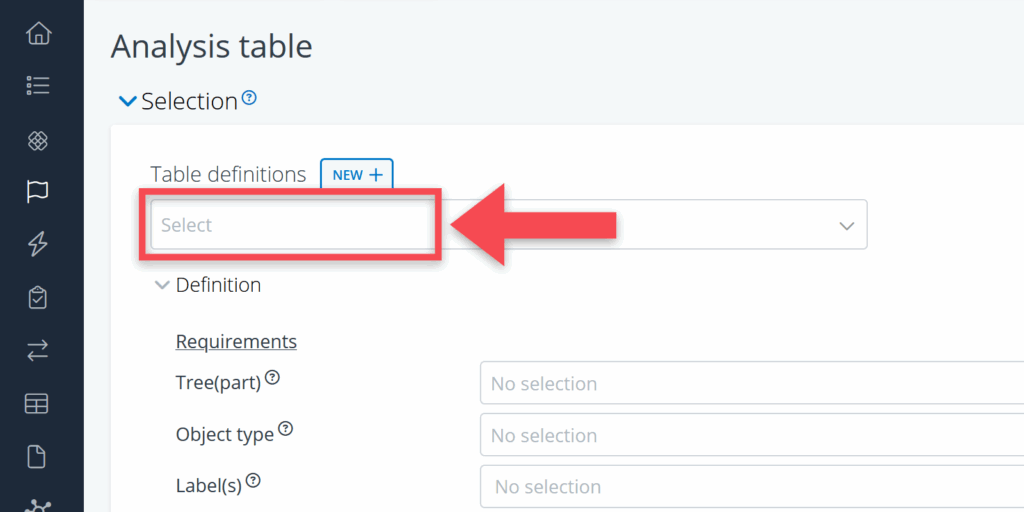
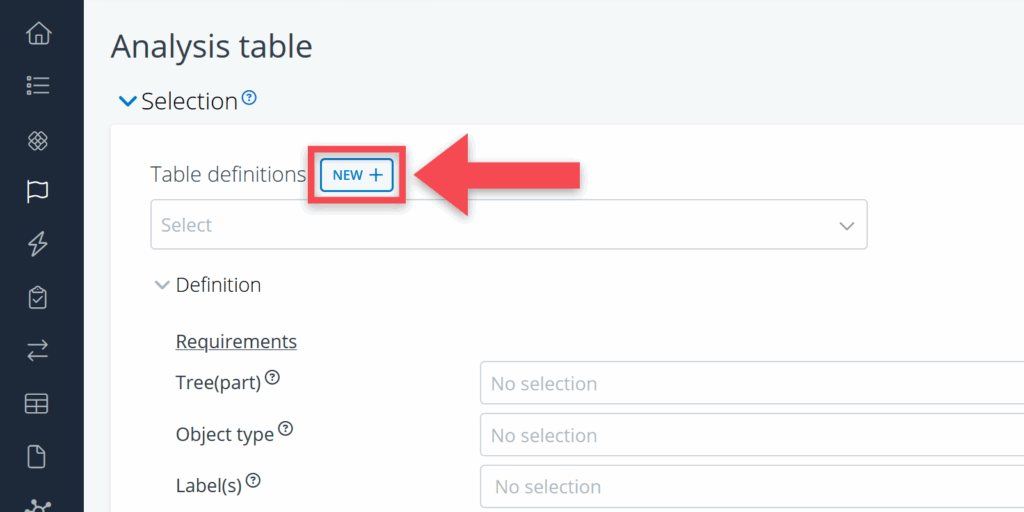
On the analysis table page, either select a predefined table definition (earlier created by either yourself or another project participant) or create a new table definition.
This article covers the process of creating a new table definition and explains the different options for selecting data to display in the table.
Creating a new table definition
As mentioned above, you have to click on the button New to create a new table definition. By doing so, you will be presented with various selection possibilities for the requirements you wish to include in your table.
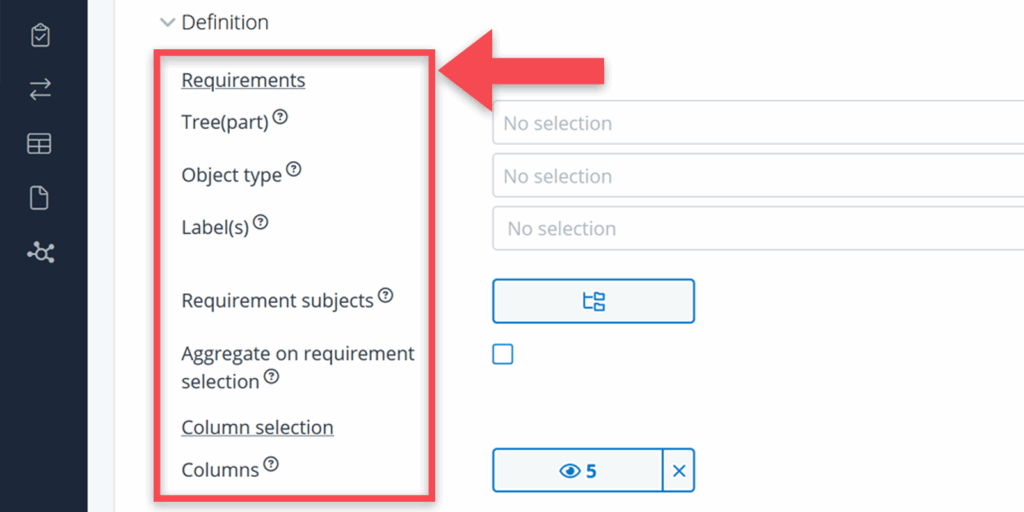
Requirements
The following selections can be made for the analysis table:
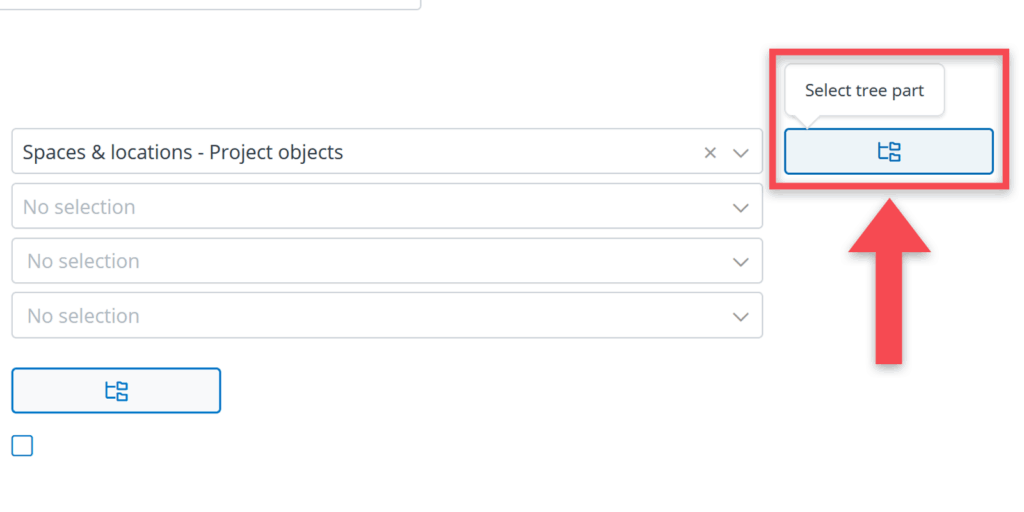
Tree(part)
Use this selection to select a particular tree (e.g. Spaces & locations tree or Systems & elements tree). In addition, you can use the Select tree part button to select a particular part of the selected tree (e.g. particular part of the building or a particular type of systems).
Object type
Trees can contain different types of objects (e.g. buildings, groups of spaces, spaces, outdoor spaces, …). Use this selection to focus on one particular type of object.
Label
Objects may have particular labels. Use this selection if you only want to see objects with a particular label.
Instance of
This selection is only available when you have selected the Spaces & locations – project objects tree and when working with typicals. It allows you to select spaces or segments that are the instances of a particular typical object (e.g. meeting room or toilet space).
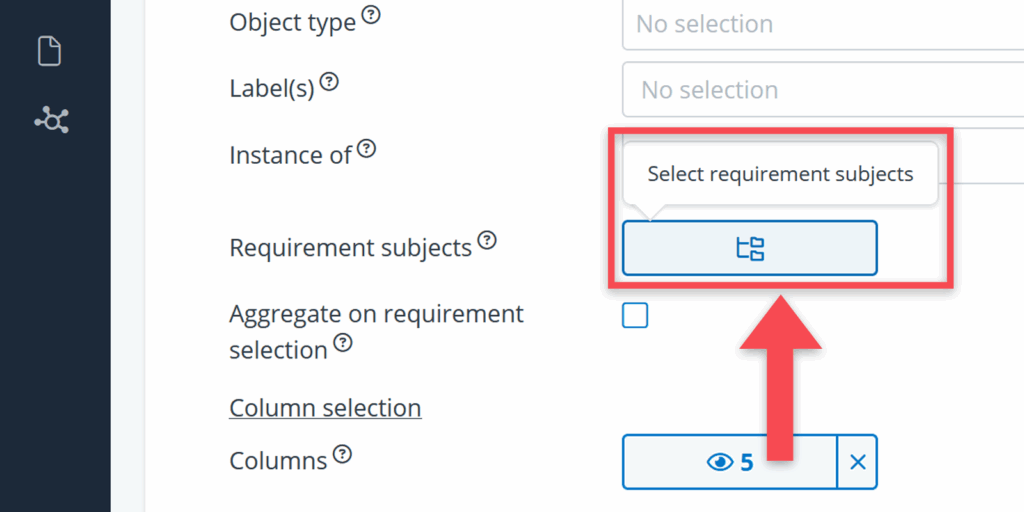
Requirement subject
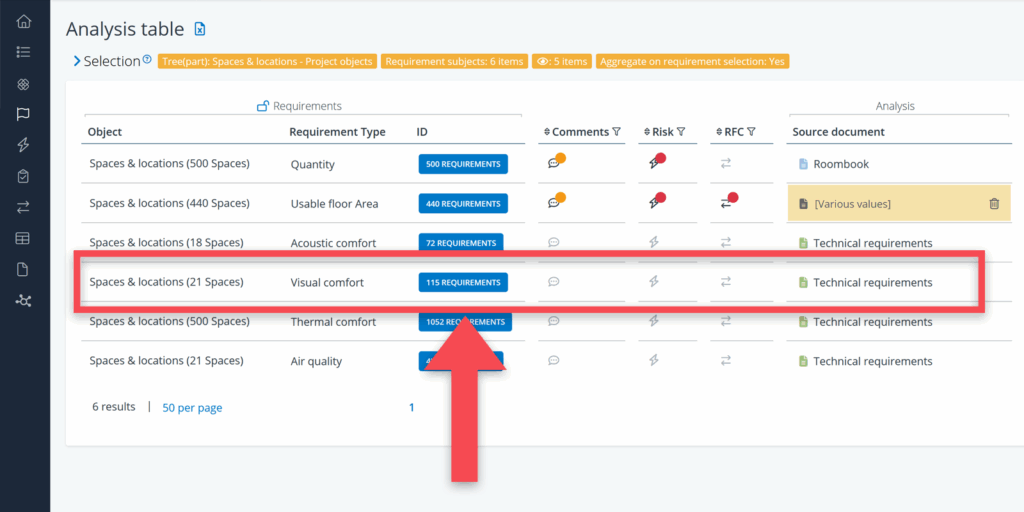
With this selection you can refine your search results by choosing a specific requirement subject. For example, for the spaces tree, you can find requirement types like visual or acoustic comfort.
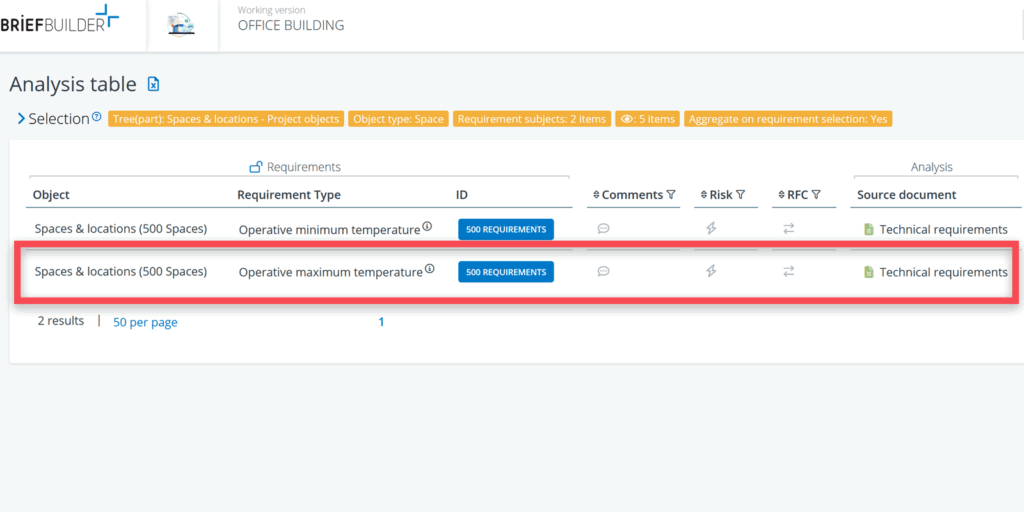
Aggregate on requirement selection
When this option is selected, the table shows an aggregated view, based on the selected requirement information. The image below shows an example of how this is presented in the analysis table.
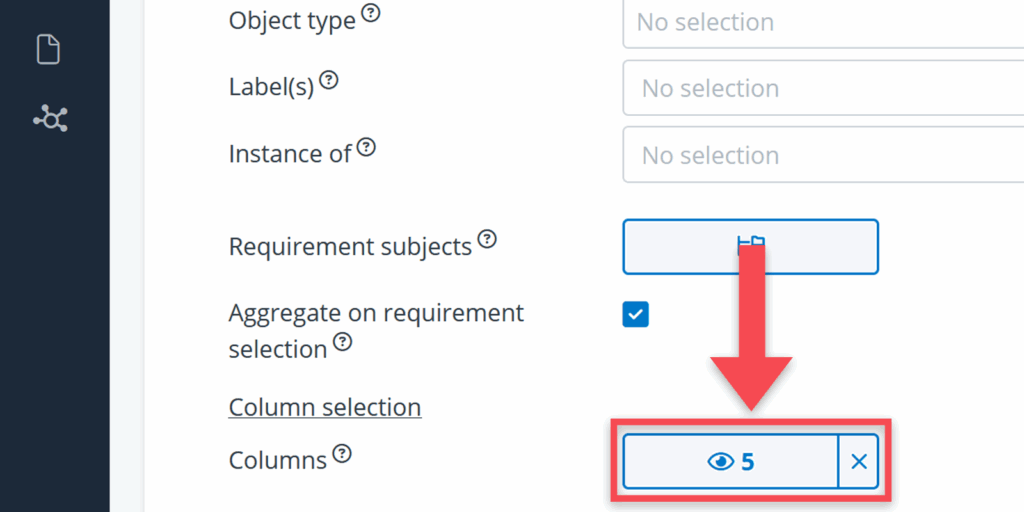
Column selection
The Column selection option in the selection menu allows users to choose which columns will be visible in the verification table and what data to show in them.
Being able to show and hide columns is an important feature because the analysis table can contain quite a large number of columns and you’re probably not interested in all of them at the same time.
Viewing and saving your table definition
Once you have made your selections, you can click on the Show button to get to the table.
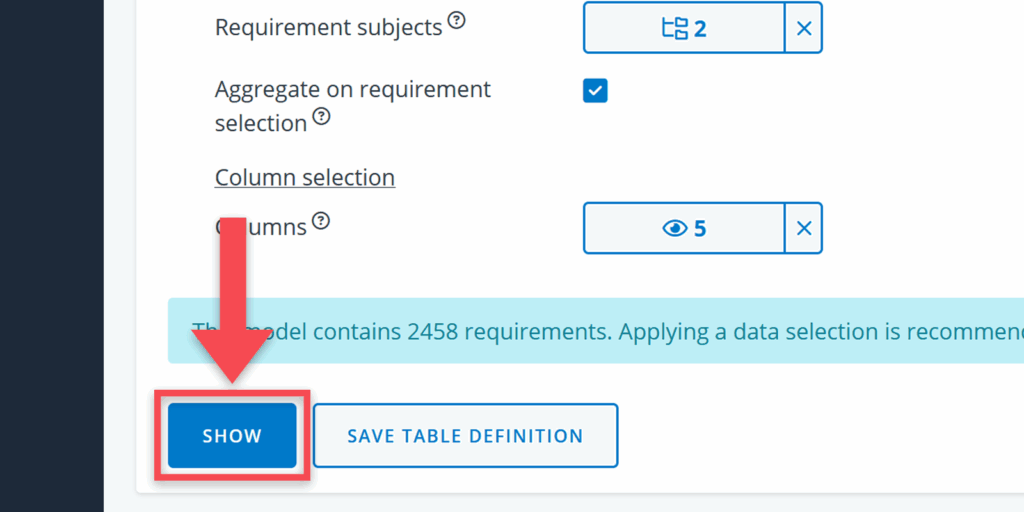
If you expect that you will need to use this table set-up more than once, then save it by clicking on the Save table definition button.
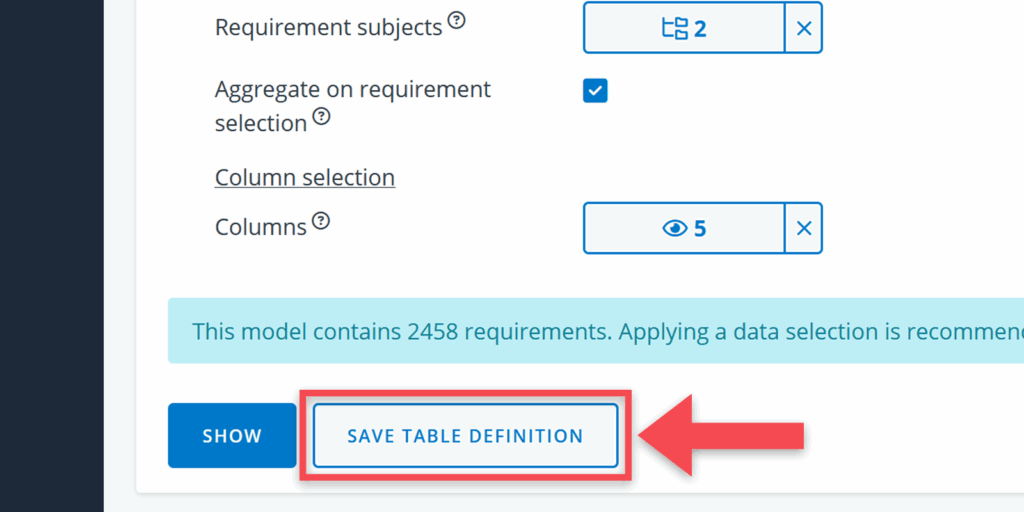
Table columns
Once you’ve selected Show, the table will display a range of columns, grouped by the type of information they represent:
- Requirement (the subject of the requirements analysis)
- RFC (possible change requests concerning a requirement)
- Analysis (the analysis ‘tags’ that has been assigned to the requirements)
- Risk (risks that have been linked to a requirement)
All types are discussed below.
Requirements
The first group of columns displays information about the requirements that have (or should have) particular analysis tags.

Object
This is the object to which a requirement belongs. Filtering in this column is very useful when looking for the requirements of a particular system or element (e.g. the HVAC system)
Requirement type
This column shows what type of requirement it concerns. Filtering in this column is very useful when you want to link analysis information to a particular type of standard property (e.g. floor heights) or a particular type of relation (e.g. adjacency relations).
Related object
This column shows objects that are related to the objects in the first column. For example power sockets that need to be placed in rooms, or the interface relations between different systems.
Value/quantity
This concerns the value or quantity of a requirement (e.g. 20 m2 or 4 items in the case of power sockets).
ID
The unique identifier of a requirement.
Deviation (only relevant when working with typicals)
An indication whether a requirement is deviating from a typical’s requirement or not. This column is useful when you want to focus on deviations in your verification plan.
Risk
This column in the table displays risks linked to a requirement. These appear as a lightning icon. A grey icon means no risk is linked; a black icon with a red badge indicates one or more risks are assigned.

Learn more in our article explaining the risk module.
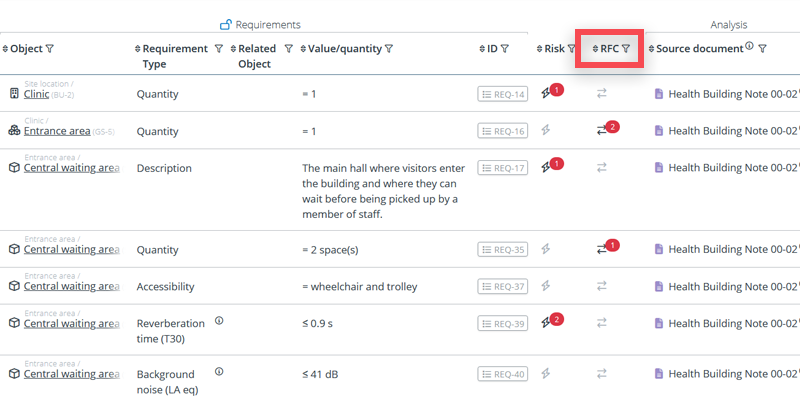
RFC
RFC stands for request-for-change. This column can be used to view and create RFC’s.
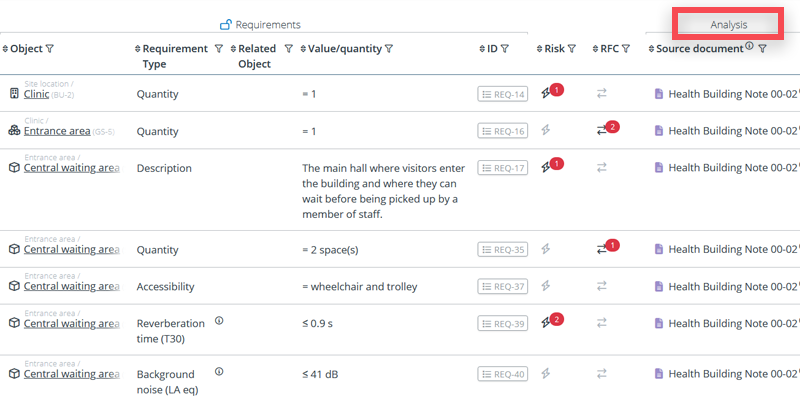
Analysis
In this part of the table, the analysis data is shown. What you’ll see here, depends on how the analysis module has been set up for your model, or more precisely, which analysis properties have been defined in the settings menu. Each analysis property is presented as a column.
Useful actions, tips & tricks
Export the table to excel
For the purpose of communication, it is sometimes easy to have data in Excel. To get an Excel export of your table, just click on the icon, right next to the overview’s name.
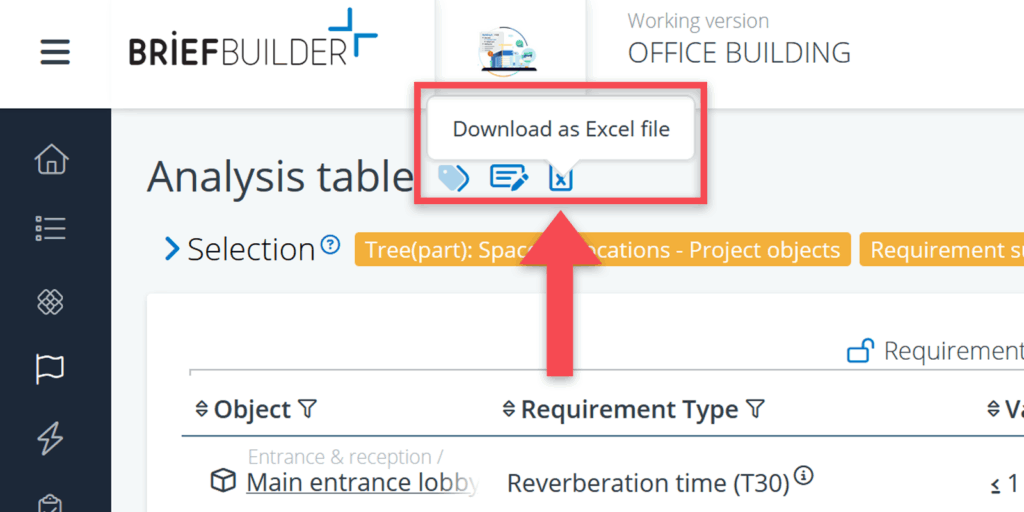
Depending on the size of the overview, it may takes some time to download the file. You can find the file in the downloads folder of your computer. More info on Excel exports can be found here.
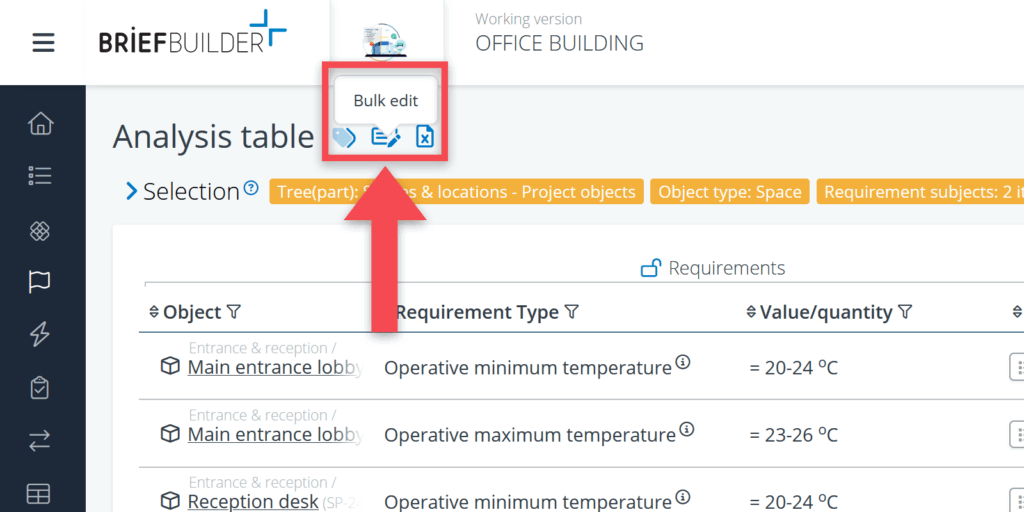
Doing bulk actions
When you have to do a lot of repetitive data edits, you can best use our bulk edit feature. Read more here about how this exactly works.
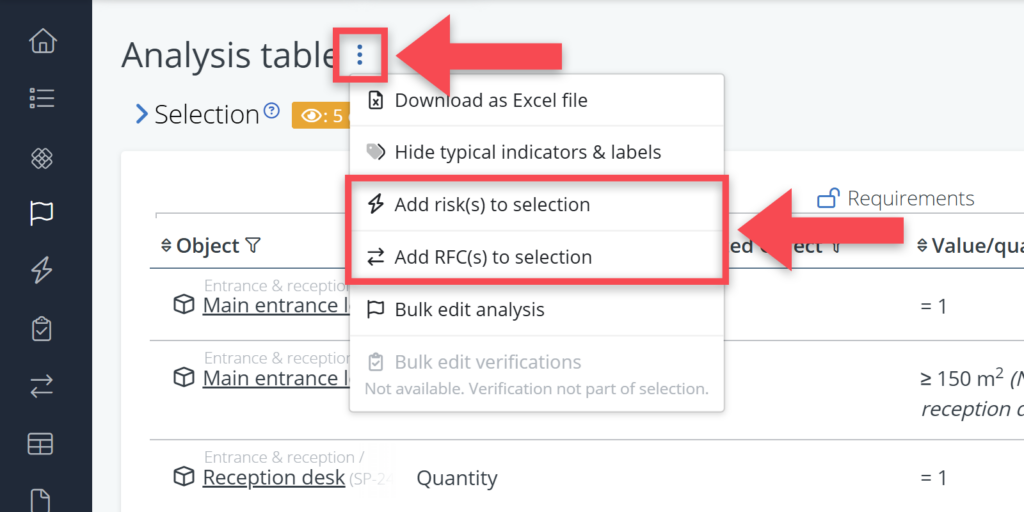
Bulk add to RFC or Risk
In addition to bulk editing analysis data, requirements that are part of your selection can be added in bulk to an RFC or a Risk. Use the More actions menu ( ) at the top of the table to access the bulk RFC or bulk risk options.
Read more about bulk RFC and bulk risk here.
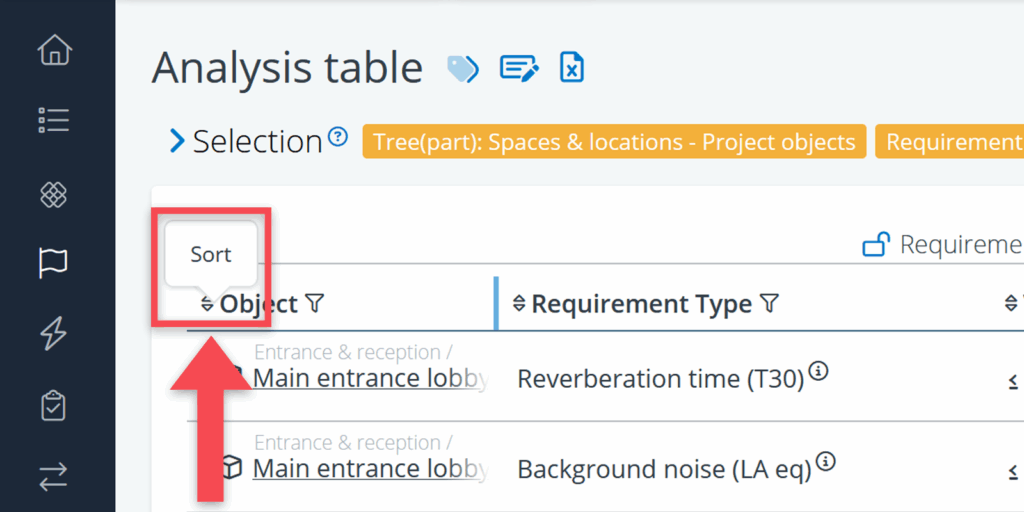
Sorting
The sorting icons are also located on top of each column. Click on the arrow pointing down to sort in ascending order, click on the arrow pointing up to sort in descending order.
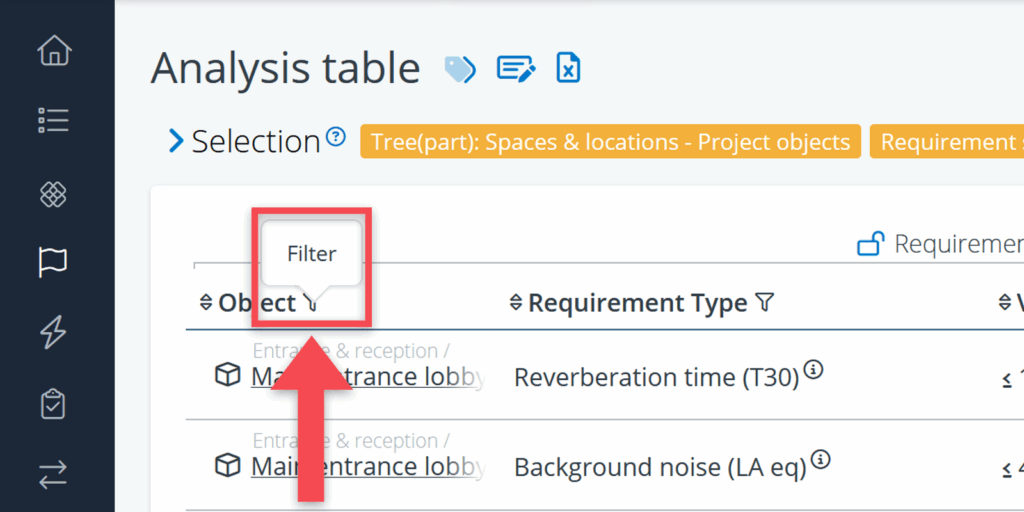
Filtering
A filter icon is located at the top of each column in the analysis table. With these filters you can filter on both requirements and analysis data.
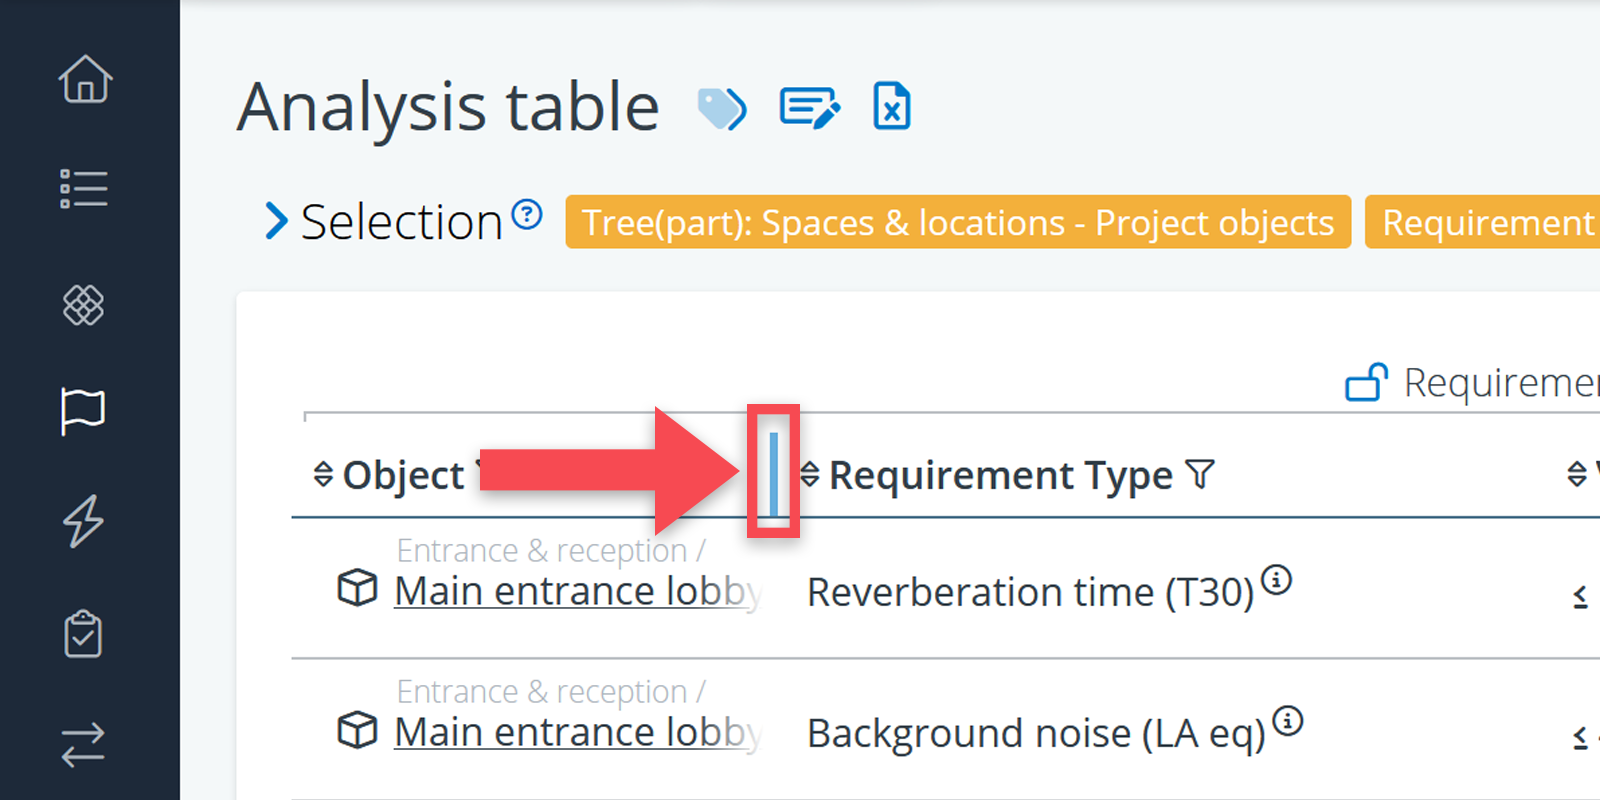
Increasing column width
For columns that have a lot of info in them (e.g. text values), it can be useful to increase the column width. This can be done in the column header by grabbing and moving the column’s border.
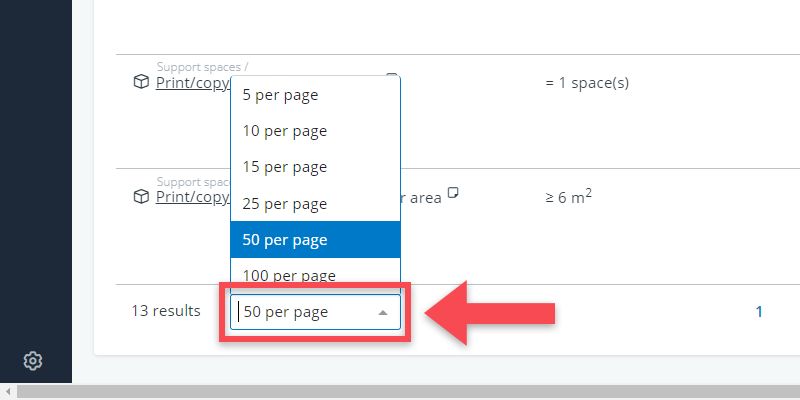
Increasing the display range
The display range concerns the number of rows that are being displayed on a page. This setting is located at the bottom of the page.You can choose between 10, 25, 50 or 100 rows per page.
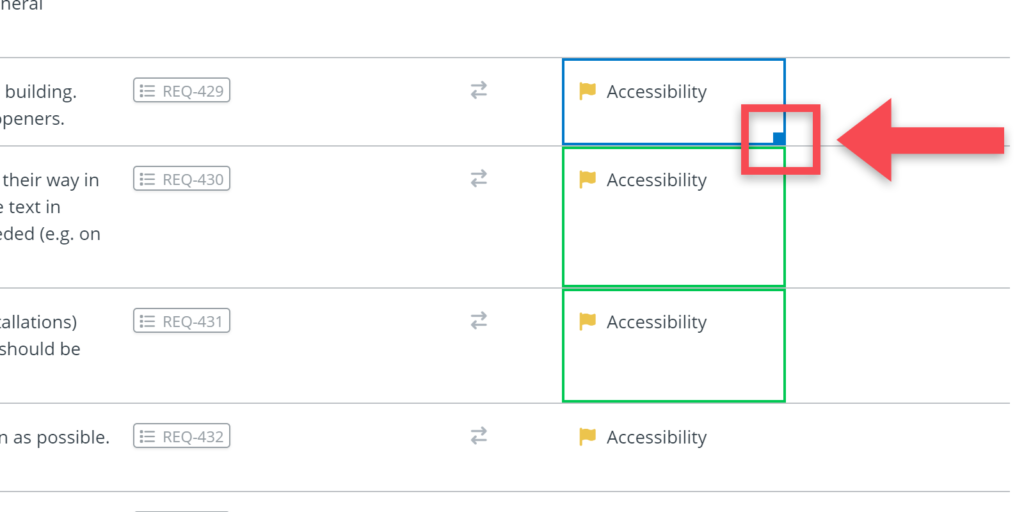
Dragging values
In the table, you are able to ‘drag’ values over multiple cells. To do this you have to:
- Select the cell with the value that you want to use;
- Click on the small blue corner of the cell;
- Hold on to your mouse button;
- And drag your mouse up/down over the cells of which you want them to have the same value.