
In BriefBuilder, there is a feature called Analysis, which allows you to tag and categorize requirements.
This feature is often used to add extra information to requirements such as the requirement’s source (e.g. corporate standards or legislation), the relevant stakeholders (e.g. the owner or the tenant of a building), or a requirement’s status (e.g. must-have or nice-to-have).
The set-up of the analysis is flexible. You can define your set-up via the settings menu. How to do that is explained here.
Once you have defined the relevant analysis properties in the settings menu, you can work with these properties at two places in the model:
(1) in the detail view of objects
(2) in the analysis table
Both will be discussed below.
Analysis in the detail view
The analysis data can be found on the detail view page of each object, by clicking on the first of the four view buttons in the upper right corner of the BriefBuilder screen. This button represents a small flag.

Once you have toggled on this view analysis button, you will see that a couple of analysis buttons have been added to your screen (which buttons these are, is determined in the analysis settings menu).

By clicking on a button, you can either add a text or choose a value, depending on the chosen input type set up in the analysis settings.
Analysis in a table
The same actions can be done in the analysis overview, which can be found under the header ‘Analysis’ in the navigation menu.

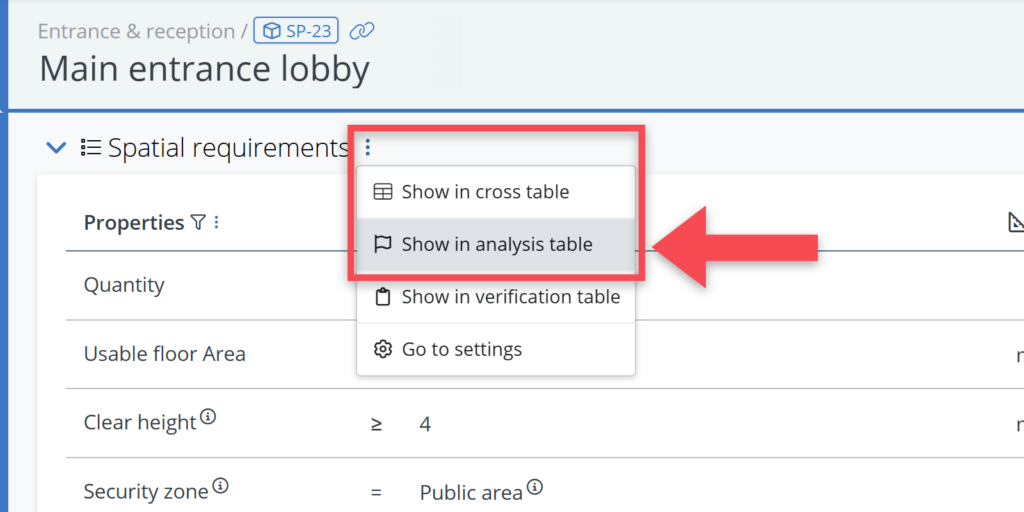
The analysis table is a great tool if you want to select and edit analysis elements for all requirements of the same type at once. For example, all the requirements concerning usable floor area. See example below.

For a short explanation, see below. A more extensive explanation can be found here.
- Use the Selection part to select a part of the model you want analyze (e.g. the spaces tree);
- Use filters within the analysis table to narrow down your search on specific requirements (e.g. usable floor area);
- View, enter and modify the analysis data in the Analysis columns of the table.
Analysis dashboard
Analysis data is also available on a specific dashboard that presents the analysis data in a series of pie charts.

Please note that you can choose to include or exclude requirements that do not have any analysis data attached to them.
