Version change reports (also known as ‘diff reports’) are reports that show the differences (data that has been modified, added or deleted) between two model versions. These reports can be useful to communicate what changes have been made in between two versions of your project.
These reports can be generated at the project models management page that lists all your active models (to go there, simply click on the BriefBuilder logo).
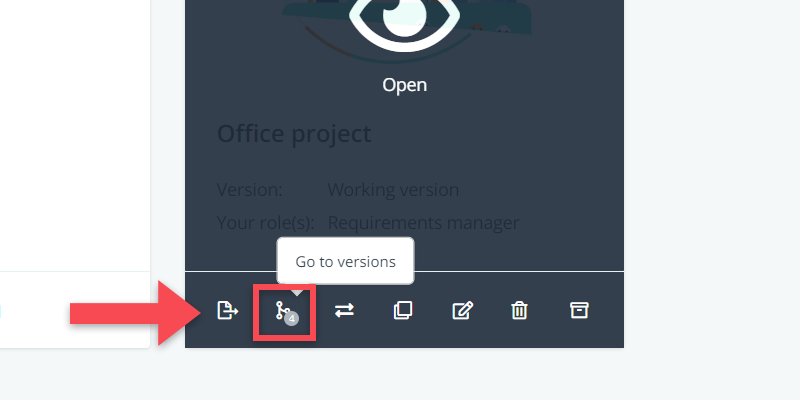
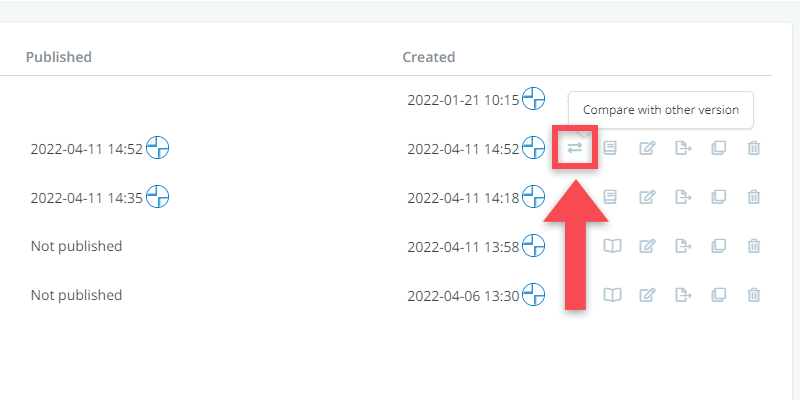
In the tile view, you first have to click on the Go to versions button (. There, you will find a compare button () behind each version name.
If you click on that, you will get to see a pop-up window asking you what to include in the report.
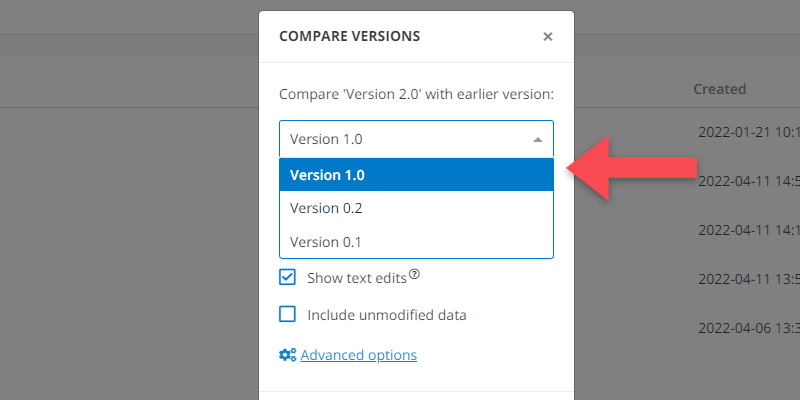
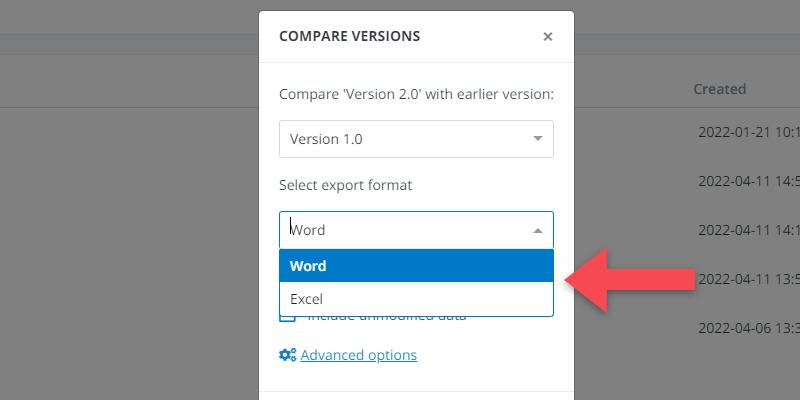
There’s also an option to select your export format. You can choose between a Word report or an Excel report depending on your preferences for format and layout.
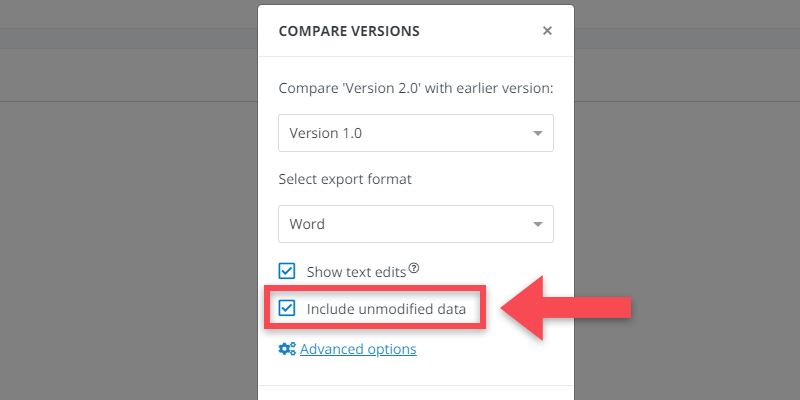
You can choose to also showcase unmodified data, giving you a report of all of the information in your entire model and not just information that has been added or modified. That can come in handy if you want a full report of your project.
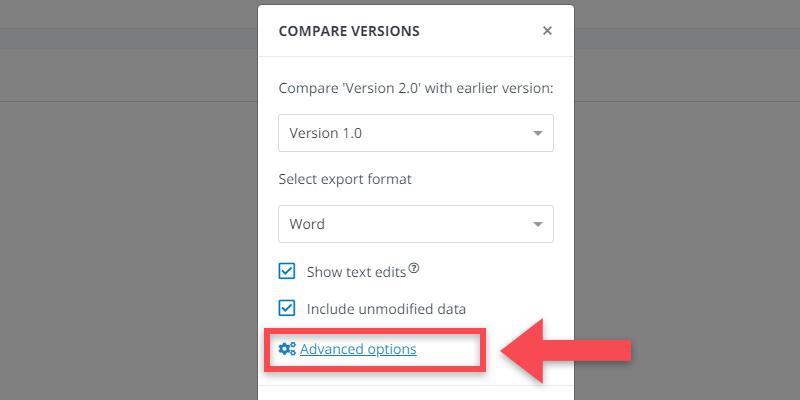
Clicking on advanced options will allow you to narrow down the report per specific tree in the model (maybe you are only interested in spaces, for example).
Once you are happy with your compare settings, you can click on the Compare button, which will then get you a report that shows the differences between this version and another version of the model (sometimes also referred to as base-lining).
You will be able to find the “diff report” in the download folder of your device. This report can be quite extensive, but it also very useful in communicating the changes that have been made in between two versions.
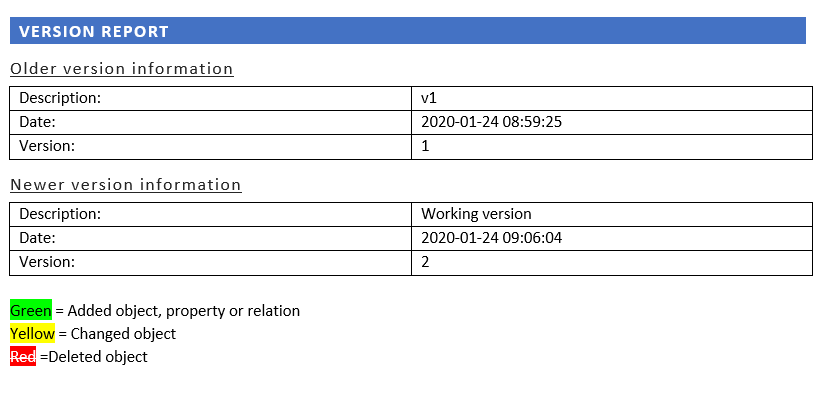
In the Word report, deleted data is marked in red, new data in green, and modified data in yellow. Unmodified data is unmarked.
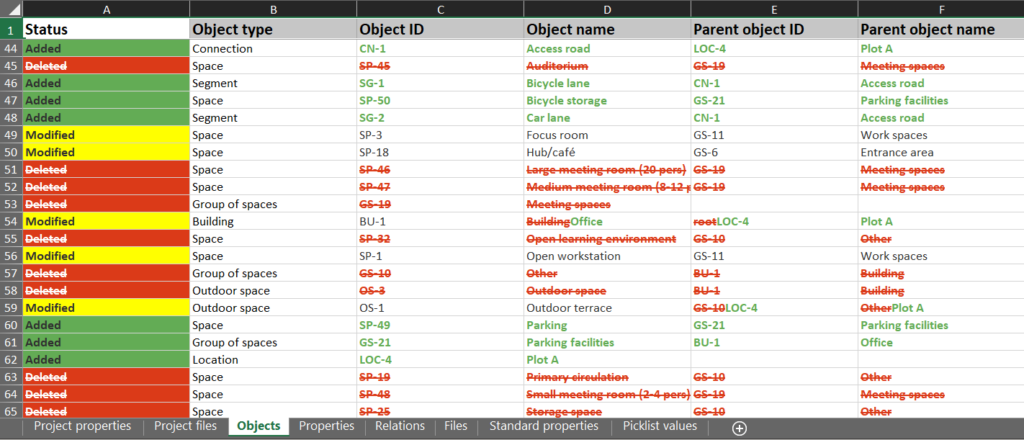
In the Excel report, deleted data is similarly marked in red, new data in green, and modified data in yellow. Unmodified data is unmarked.
Every part of the BriefBuilder model gets its own tab in the Excel report as well, with separate tabs for project properties and project files (both on the Project Home page), followed by all objects, properties, relations, files, standard properties, and picklist values.